For all those who THINK you are stuck

JohnnyLowCarb
Posts: 418 Member
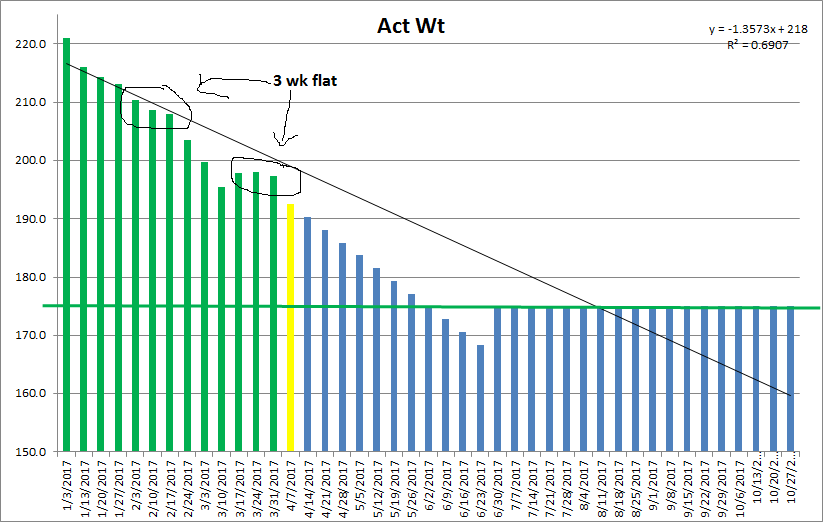
So it was not that long ago that I reached out to this wonderful community and vented that I was stuck. So many veterans reassured me that if I was doing everything right that it would happen and to be patient. So I looked at a chart that I maintain (Green is Actual, Yellow is the current week, and Blue is projected future - Yeah I am obsessed and a data junkie) . I like the weekly measuring to remove some variability, but I still log in to MFP my daily number. I have found that after a period (weeks) of sustained weight loss my body will go on a 3 week straight line and then start going down again. this may or may not be your body's reaction. I simply post this for those who may get discouraged on what I did to understand my body's reaction. Study your own situation and see what you can determine. This (and the Low Carb group) really helped me!
6
Replies
-
-
Maybe it's a guy thing. I also have a spreadsheet with a chart and map actual vs planned. It helps me to focus towards the long term. Yours has more colours. I may need to upgrade
") 4
4 -
That made me laugh!TravellerRay wrote: »Maybe it's a guy thing. I also have a spreadsheet with a chart and map actual vs planned. It helps me to focus towards the long term. Yours has more colours. I may need to upgrade
0 -
<refresh>0
-
I need to make one. That would be really helpful!0
-
@LemonMarmalade For me it is now a tool to calm me down. I use excel and simply track my weekly weight. I use the average weekly loss to project the out dates. The green horizontal line is my desired weight. You should be able to see your own trends as you start tracking.1
-
Did you go a step further and calculate your fat percentage? I did that and then projected the weights I would start to hit acceptable levels 0
-
TravellerRay wrote: »Did you go a step further and calculate your fat percentage? I did that and then projected the weights I would start to hit acceptable levels
No TraveelerRay, how are you measuring your fat %? Calibers or ht wt measurements? Very good strategy.0 -
Funny you post this, I started Keto the last week of January at 268, got to 255 within a 4 weeks then sat there for 4 weeks, in the last 10 days I've dropped down to 247, i assume I will plateau again soon but it's nice to see progress.2
-
Data is part of the reason I do love treadmill running....that and I'm truly a fair weather runner. Snow? Nope. Rain? Nah. Wind? Pass.
For a lot of us, good data about what our body is doing helps keep us motivated and make sense of weight loss and gain which sometimes feel like black magic and *kitten*.1 -
The app Happy Scale does very similar....for those of you that are less computer savvy1
-
I'm very similar. In a one month period of losing I often only have one or two weeks when the scale actually moves down ward.TravellerRay wrote: »Maybe it's a guy thing. I also have a spreadsheet with a chart and map actual vs planned. It helps me to focus towards the long term. Yours has more colours. I may need to upgrade
Not a guy thing.") Except I am old school and do it on graphing paper. LOL
Except I am old school and do it on graphing paper. LOL
4 -
What is graphing paper???? Lol jk1
-
I am not a guy, and I have a love affair with excel
 Data and charts make me happy. Maths that does not add up make me unhappy. I tend to lose about 1lb a month, it's taken me 4 years to lose 85lbs but you know what? If I didn't make that change 4 years ago I'd still weigh 270lbs and probably have full blown type 2 diabetes. So I'll take it. 6
 -
@EbonyDahlia awesome true great job0
-
Funny you post this, I started Keto the last week of January at 268, got to 255 within a 4 weeks then sat there for 4 weeks, in the last 10 days I've dropped down to 247, i assume I will plateau again soon but it's nice to see progress.
I was right, been here for 2 weeks now, I'm really looking forward to that next whoosh.
0 -
Which data are your trendline based on? The R2 seems low.0
-
I have a spreadsheet too. I weigh in an it automatically calculates my current BMI (I know, I know, but it's *a* benchmark at the moment)1
-
Which data are your trendline based on? The R2 seems low.
The trend line is based on the actual weight and it does incorporate the projected and the projected ultimate desired weight at 175 so the R2 is being affected by those out months where I have projected weight loss and weight stability. As long as I am below a declining trend line I dont worry about the R2 too much.0


This discussion has been closed.