My non-linear weight loss

LTKeegan
Posts: 354 Member
So I've been frustrated and ringing my hands as to why the scale was stuck at 137. I even caved and posted last night asking for help with my "plateau". Then I saw this post
http://www.myfitnesspal.com/topics/show/1111515-for-the-nerds-in-you-tdee-estimation-with-graphs
Where I plotted my weight loss against my expected weight loss for mins and maxes and what not. And it got me thinking. What does MY weight loss look like.
So here is a story, shown through graphs, of the first 1.5 months of this journey. HOPEFULLY this can help some newer people out when they get "stuck" (and frustrated) like I did.
Once upon a time there was a girl who was new to dieting, but decided to give it a try. I worked really really hard and exercised a lot and stayed under my calorie goals but stopped losing weight for 4 weeks. FOUR. WHOLE. WEEKS. And that was rough.
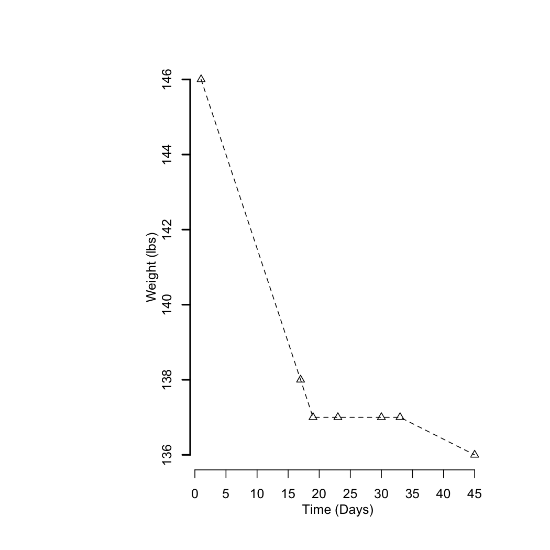
And people said weigh your food, calories in calories out, bla bla bla, but I did it faithfully and nothing happened.... Or so I thought. Then I got the brilliant idea to actually look at what was happening with all those measurements I'd been taking, and I saw:
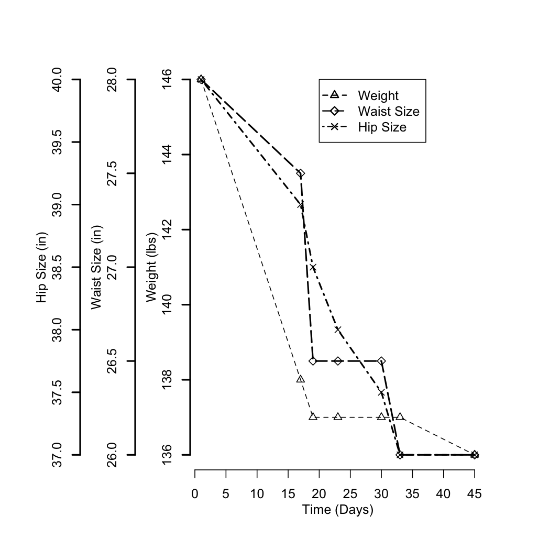
Which made me feel a little better, but not totally. So then I wanted to know what I "should" be losing if my weight loss were linear.
And then I felt way better, because by golly, I AM losing the "right" amount of weight, just not at the "right" speed.
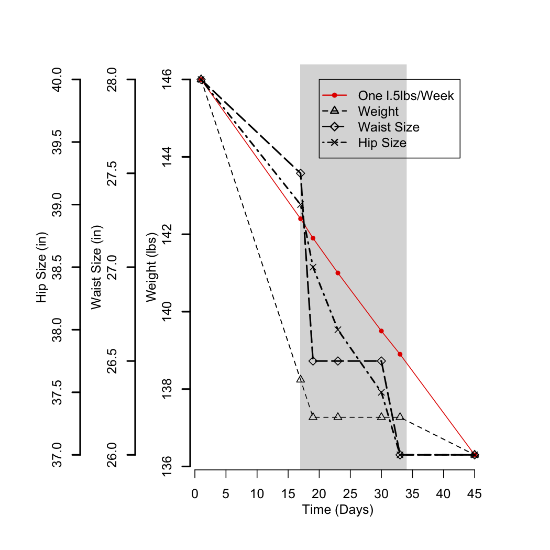
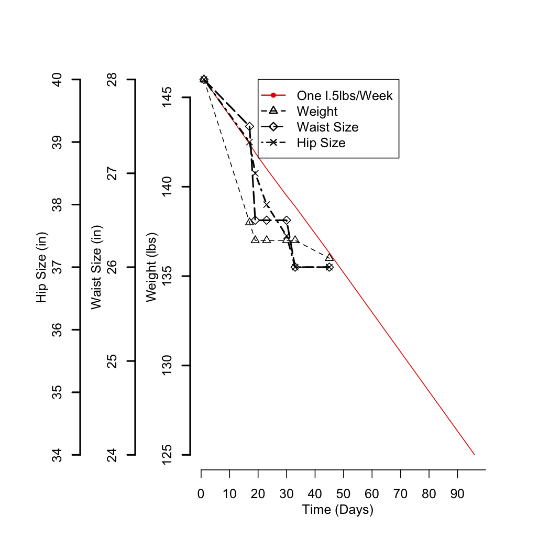
So then I decided to explore the "plateau" I had been so frustrated by (highlighted in grey):
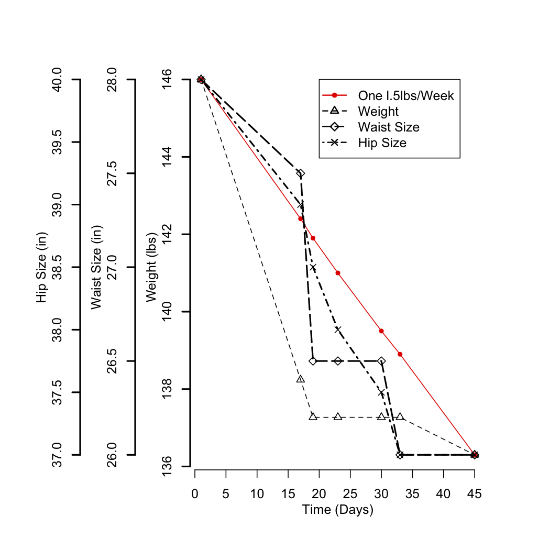
And after visualizing my data, I realized I wasn't in a plateau at all! I had been losing inches off My hips and waist (though not a at a linear rate) the whole time I had been stressing about not losing weight but working so hard! And then, I was curious, although my weight loss is CLEARLY not linear, what would happen if I did a linear regression?
Coefficients:
(Intercept) time
143.1394 -0.2022
The slope of my weight loss is -0.2022/day. Or almost 1.5lbs per week.
And that my friends, is why you never trust the scale.
Oh, and just because I'm interested, this is where I will be (hopefully) in another 1.5 months:
http://www.myfitnesspal.com/topics/show/1111515-for-the-nerds-in-you-tdee-estimation-with-graphs
Where I plotted my weight loss against my expected weight loss for mins and maxes and what not. And it got me thinking. What does MY weight loss look like.
So here is a story, shown through graphs, of the first 1.5 months of this journey. HOPEFULLY this can help some newer people out when they get "stuck" (and frustrated) like I did.
Once upon a time there was a girl who was new to dieting, but decided to give it a try. I worked really really hard and exercised a lot and stayed under my calorie goals but stopped losing weight for 4 weeks. FOUR. WHOLE. WEEKS. And that was rough.
And people said weigh your food, calories in calories out, bla bla bla, but I did it faithfully and nothing happened.... Or so I thought. Then I got the brilliant idea to actually look at what was happening with all those measurements I'd been taking, and I saw:
Which made me feel a little better, but not totally. So then I wanted to know what I "should" be losing if my weight loss were linear.
And then I felt way better, because by golly, I AM losing the "right" amount of weight, just not at the "right" speed.
So then I decided to explore the "plateau" I had been so frustrated by (highlighted in grey):
And after visualizing my data, I realized I wasn't in a plateau at all! I had been losing inches off My hips and waist (though not a at a linear rate) the whole time I had been stressing about not losing weight but working so hard! And then, I was curious, although my weight loss is CLEARLY not linear, what would happen if I did a linear regression?
Coefficients:
(Intercept) time
143.1394 -0.2022
The slope of my weight loss is -0.2022/day. Or almost 1.5lbs per week.
And that my friends, is why you never trust the scale.
Oh, and just because I'm interested, this is where I will be (hopefully) in another 1.5 months:
0
Replies
-
Very very nice post. I am actually gaining weight but I have almost dropped a size in the past month. I have a feeling my body is simply turning into a she-hulk and that it just fine.
 Keep up the positive attitude. 0
 -
Awesome post and very encouraging. I'm impressed with the work you put into all that charting -- thanks for sharing it.0
-
Awesome post!0
-
Awesome! Thanks for sharing, we hit those little "plateaus" now and again and this is very encouraging!0
-
If I had seen this in high school, it might have made me fall for maths. Instead, I just want to hug OP. Great job!0
-
I just took an algebra in statistics class and as someone who usually has "the dumb" when it comes to math, I'm very pleased I could follow your post because it was VERY interesting! Seriously, I applaud the work you put into this because it's really cool to visualize the numbers!
I've had a similar issue that I thought was a problem with my weight not budging on the scale but then the realization that I'm losing inches even when that number doesn't move for a while is definitely a pick me up") 0
0 -
Awesome work! Great job.0
-
Thank you for taking the time to share your journey and findings. It's nice to see "the big picture" and not just the scale number. You're doing a great!0
-
Thanks guys! I'm a PhD student in bio math, so it didn't take that much time to make up these figures. But I found it so helpful for me in visualizing the changes my body was making. And I see SO many threads saying 'I've "only" lost 6lbs in 4 weeks, what's wrong!' So I was hoping this could explain what's "wrong".
And for those of you who said I made you find math interesting (even just for a second) that is AMAZING!! I teach math-bio to biology undergraduate students and I always hope that I can make at least one enjoy math even just a little more than before :-) so that means a lot to me!!0 -

Yes...I love it when someone gets it. This is 100% exactly what all of us mean when we say, "weight loss isn't linear"..."you need to look at it as a general trend over time", etc.
Also, you should see what maintenance looks like on one of these kind of graphs...that's a real trip.0 -
Great post OP!
You and I are two peas in a pod albeit your math has got to be more beautiful than mine I just like to play in Excel. I have been capturing data like this for the past 7 weeks since I have been on this site.
SW 182
CW 166
The slope of my weight loss is -0.4/day. Or almost 1.9lbs per week. Right on target with my goal.
I wish MFP would show data like this to its members. For me, they give me so much grit and determination!!!! If I just relied on the scale or the letters in red font I think I would have given up. :sad:
I only measure 2x per month and I really look forward to it. Capturing the decrease that I can see and feel is so rewarding. I have a lot of "garment goals" so this is where I get the most satisfaction.
Thanks for sharing your knowledge. :happy:0 -
I love this! I'm such a data visualizing/analyzing nerd... everything is better with graphs! I'll have to do this with my own stats at some point. :happy:0
-
Thanks guys, I really hope this can help some new, frustrated people out. The first few weeks are SO deceiving!!0
-
Love it!!!!!0
-
So awesome! Thanks very much, you made my day.
 0
0 -
i read this a while ago, and it clicked, then i binged...for a month. now im back on track, a week in, and i looked this back up, so i can stay focused on reality. thank you.0
-
YAY!!!!!!!! love the plotting etc. and great message!!!! YAY!!!
Stata rules (although I don't recognize the graphs as Stata graphs... hrumph) 0 -
Thank you for doing this and sharing it with us! I have been stuck on the same weight for almost two weeks and your graph is encouraging.0


This discussion has been closed.
Categories
- All Categories
- 1.4M Health, Wellness and Goals
- 398.1K Introduce Yourself
- 44.7K Getting Started
- 261K Health and Weight Loss
- 176.4K Food and Nutrition
- 47.7K Recipes
- 233K Fitness and Exercise
- 462 Sleep, Mindfulness and Overall Wellness
- 6.5K Goal: Maintaining Weight
- 8.7K Goal: Gaining Weight and Body Building
- 153.5K Motivation and Support
- 8.4K Challenges
- 1.4K Debate Club
- 96.5K Chit-Chat
- 2.6K Fun and Games
- 4.8K MyFitnessPal Information
- 12 News and Announcements
- 21 MyFitnessPal Academy
- 1.5K Feature Suggestions and Ideas
- 3.2K MyFitnessPal Tech Support Questions