Can anyone point me to weight loss charts of people who have lost significant weight?

Geocitiesuser
Posts: 1,429 Member
I'm down about 60lbs, but the progress isn't always linear. Despite eating the same exact thing most days, and not going off of "my diet" in 6 months+, the scale likes to play games. It averages out to ABOUT 2lbs a week, but sometimes it spikes up or stays flat and I don't understand why, to me it seems physically impossible, and even though I know I'm on the right track I find it to be infuriating.
I have found it is helpful to see examples of other people's weight loss that is not in a straight line.
My brain wants to say to myself that if I'm in a defecit I should see the scale go down each week like clock work, but that's not always the case, and it's not because I'm sneaking twinkies in the middle of the night.
Cheers!
0
Replies
-
Here's what mine typically looked like every month when I was losing weight:
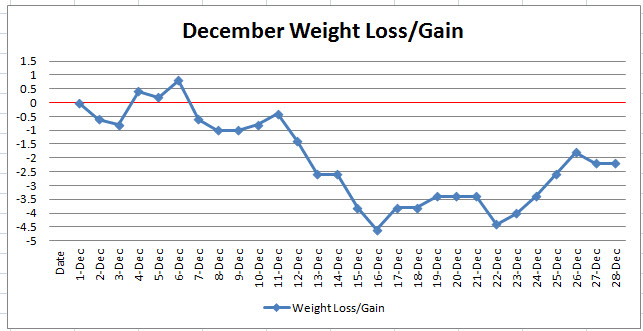
It's barely over 2 pounds for the month, but it's better than gaining and still is a loss.1 -
Here is mine since Feb. The light gray squiggly line is my actual weight, weighed in almost every single day. The red line is the trend, it basically smoothes the grey line's up and down fluctuations. It's pretty normal for weight to vary due to several factors.

1 -
I have lost over 90 lbs. overall. I occasionally gain too many pounds in maintenance and have to go back into a deficit to get back to my goal range.
I would say a week or even three weeks in a consistent deficit without noticeable weight loss is common.
Many people use online charting tools (such as TrendWeight, Happy Scale, or others) that use a moving average line, usually 7 or 10 days, which will smooth out the inherent noise of daily or weekly weigh-ins.
Here is my TrendWeight chart, where I noted how many days it could appear that I was at a "stall," but I really wasn't, it was just a normal recovery from a particularly low weigh-in. If you are recording weight weekly, it would sometimes appear that the weight loss has slowed down or it has stopped, when in actuality, the general trend is downward. 1
1 -
Thanks so much for the charts everyone. Really helps my outlook. I'm going to look into these trending graphs as well!1
-
Mine looks like a roller coaster! Track your weight daily & you will soon learn your trends & what to expect.0
-
I've weight daily for the last 7 months and the weight loss is not at all steady. What I discovered when I analyzed the weight loss data (I'm a geek, I can explain what I did if you really want to know), is that my daily fluctuations were plus and minus 2.5 lbs. So on any given day I could be anywhere within a 5 lb range, you can see how that means there are many ups and downs in the short term, but the important thing is that overall trend is down. So many things can effect day to day weight, water, hormones, not having a BM that day...0
-
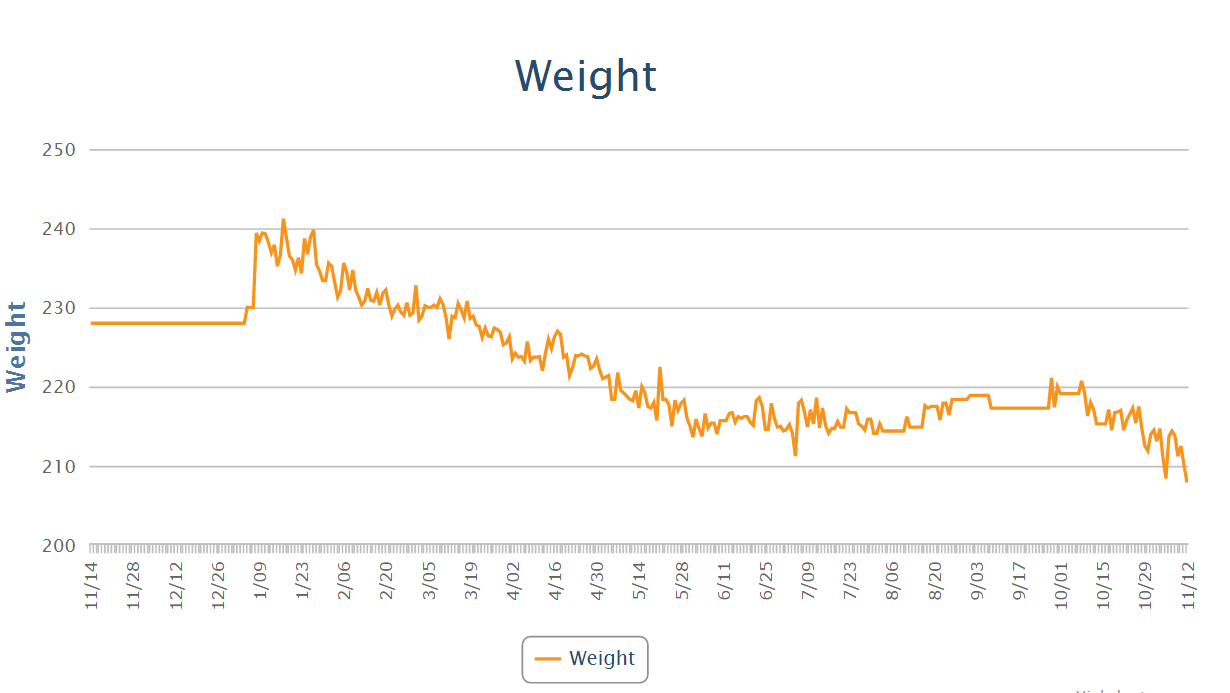
Here's mines, its all over the place. I was even stuck at 215 for like 3 months.
2 -
Here is a close up on the last 8 days (the weigh in values are those little hollow diamonds). Notice how it appears to be as if I've been steadily gaining? Then I had this sudden drop of 2.3 kgs (about 5 lb), which means I have been actually losing while the scale readings said I was gaining due to water retention. Small sections don't always make sense, you need to look at your weight over a span of a couple of months to see how things are going.

0 -
My chart won't help. I don't enter the little spikes in weight, because I know they'll disappear again. I just look for the overall trend, and I'm happy. Like OP, I was typically about 2lbs a week for my first 60lbs lost. I'm down to about 8lbs to go, and it is slowing to about 1lb a week, which isn't surprising. I ignore the slight increases, I always get back to where I was and lower.0
-
In the interest of thanks and fairness, here is my last 30 days on myfitnesspal. The long two week stretch is accurate, I weighed in at the same exact weight every single morning for close to three weeks.
Thanks again all. It just really helps seeing that weight loss is not as linear as "lose 1lb every 3.5 days" even though the over all trend points there, and most literature would have you believe that if it doesn't happen you're doing something wrong. (I can't tell you how many articles I've read claiming I need to completely change everything because the scale doesn't budge for a week or two).
2 -
This is one of the best threads I've read here, really puts things in perspective. Had a tough couple of weeks trying to get the scale to move but its so true you have to review the TREND!0


This discussion has been closed.
Categories
- All Categories
- 1.4M Health, Wellness and Goals
- 398.2K Introduce Yourself
- 44.7K Getting Started
- 261K Health and Weight Loss
- 176.4K Food and Nutrition
- 47.7K Recipes
- 233K Fitness and Exercise
- 462 Sleep, Mindfulness and Overall Wellness
- 6.5K Goal: Maintaining Weight
- 8.7K Goal: Gaining Weight and Body Building
- 153.5K Motivation and Support
- 8.4K Challenges
- 1.4K Debate Club
- 96.5K Chit-Chat
- 2.6K Fun and Games
- 4.8K MyFitnessPal Information
- 12 News and Announcements
- 21 MyFitnessPal Academy
- 1.5K Feature Suggestions and Ideas
- 3.2K MyFitnessPal Tech Support Questions