Nutrition Chart - Net Calories

paulkilroy
Posts: 3 Member
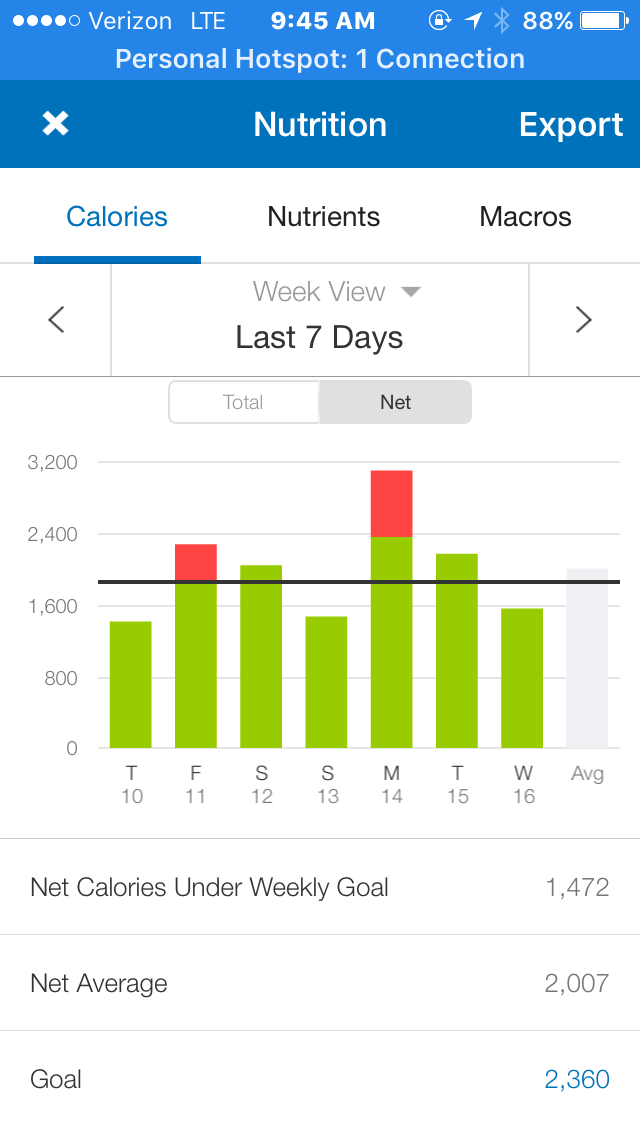
I could use some help trying to understand this chart after my first week on MFP.
Comments:
-I exercised on Thursday, Sunday and a little on Wednesday. Thursday and Sunday burned 2000+ calories.
-I set MFP to a goal to maintain weight and a sedentary lifestyle because I track calories in and out with high accuracy when I add my workouts, etc.
-My calorie goal is 2,360 which seems right based on a BMR of probably 2,000 and a desk job that burns 300 calories a day.
Questions:
-What is the black line? I thought it would be my goal, but it seems to be at around 1,800 calories and my goal is currently set at 2,360 calories. So what does it represent?
-What are the Red bars? It would seem like those are where I'm above goal, but what is the deal with Monday?
-Am I really 1,472 calories under my goal, so I will loose roughly 1/2 pound of fat?
0
Replies
-
Interestingly, the webpage view makes a little more sense with the line drawn at 2,360 calories..

0 -
On the mobile app, the black goal line represents what the goal was on the first day of the last seven days (Thu the 10th).
Most likely, the goal was changed sometime after Fri the 11th and before or on Mon the 14th. The data below the graph on the mobile app represents the seven-day calculations using the different daily goals and should be correct for the Net Calories as shown. Once you have the same Calorie goal for the last seven days in a row, the graph line should show correctly.
On the web version, the red goal line represents the current daily goal at the time the report is run.
The mobile app and web version use different charting routines, so they can show different results when you update goals within the seven-day period.1 -
That is what happened. Thank you!0

This discussion has been closed.
Categories
- All Categories
- 1.4M Health, Wellness and Goals
- 398.5K Introduce Yourself
- 44.7K Getting Started
- 261K Health and Weight Loss
- 176.4K Food and Nutrition
- 47.7K Recipes
- 233K Fitness and Exercise
- 462 Sleep, Mindfulness and Overall Wellness
- 6.5K Goal: Maintaining Weight
- 8.7K Goal: Gaining Weight and Body Building
- 153.5K Motivation and Support
- 8.4K Challenges
- 1.4K Debate Club
- 96.5K Chit-Chat
- 2.6K Fun and Games
- 4.8K MyFitnessPal Information
- 17 News and Announcements
- 21 MyFitnessPal Academy
- 1.5K Feature Suggestions and Ideas
- 3.2K MyFitnessPal Tech Support Questions