Lessons Learned & Learning: First 30 Days of Maintenance
Options

Ejourneys
Posts: 1,603 Member
Today is Maintenance Day 31 and I'm feelin' fine. Here's what the first 30 days looked like:
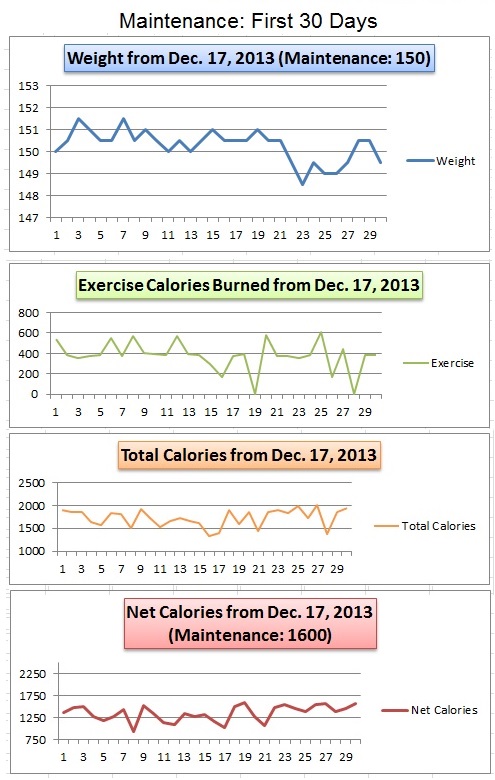
Weight: My maximum weight fluctuation in either direction, up or down from my goal, came to 1.5 pounds. I had last weighed 151.5 back on Dec. 23, 2013. I had dropped to 148.5 on Jan. 8, 2014, and increased my calories to keep it from dropping further. Today's weight of 150.5 (not shown), up a pound from yesterday, reflects in part my highest net calorie consumption (1559) and my third-highest total calorie consumption (1941) in maintenance. In addition, yesterday's meal out had increased my sodium intake. I had also focused last night on eating more, in preparation for today's long (for me) run.
Exercise Calories Burned: I took two rest days (0 calories burned) over the past 30 days and otherwise kept mostly to an approximate 400-calorie daily burn, representing an hour on the mini-bike. Exceptions include up-ticks for running days and yard work performed in addition to the bike; and lesser burns for a low-burn walk, a short run, and a 30-minute bike session. Average exercise calories burned (including rest days) equaled 377/day.
Total and Net Calories Consumed: Total calories averaged 1727/day and ranged from 1321 on New Year's Day (the day of my second-lowest-burn workout) to 2019 on Jan. 12 (which also marked a slightly higher-than-average calorie burn from exercise). Net calories (total calories minus exercise calories burned) averaged 1350/day and ranged from 944 to 1559. With MFP's maintenance set at 1600 net, however, that indicates undereating on my part.
Dividing the month into two equal sections of 15 days each shows an adjustment as I learn to tweak my consumption. Increased daily average consumption is negligible for total calories (1721/day for the first half, 1732/day for the second half), but is much more pronounced for net calories (1299/day for the first half, 1400/day for the second half, an almost 8 percent increase).
Also interesting is the drop in my weight coincident with increased net calorie consumption. Again dividing the 30 days into two equal parts, my average weight comes to 150.63 for the first half and 149.93 for the second half. The rises and drops in the graph demonstrate that nicely.
That said, I am still eating below maintenance. On the other hand, I don't vouch for complete accuracy in calories eaten and burned and I give myself some wiggle room there. My tweaking continues, but I am very happy with the weight range I'm in. My recognition of hunger signals has also been improving. Put simply, if I feel hungry I eat -- after checking with my body and with my macros to hone in on just what type of food I'm really hungry for.
Body Composition: I did not take measurements on Dec. 17, 2013, the day I reached my goal weight; but I had taken them on Nov. 20. New measurements taken on Jan. 12, 2014 showed an additional 1.25 inches lost. According to my calipers, my body fat percentage has now dropped from 27.6 percent (the middle of the "ideal" range for a woman my age) to 25.9 percent, placing me at the low end of "ideal." Lower than that will move me into the "lean" range.

Source: Accu-Measure
The last time I had fallen into the "lean" range, I was 43 and my body fat had dropped to 18.8 percent. I learned my lesson when an evening stroll almost gave me a case of hypothermia and my face and hands had literally turned blue. Thanks but no thanks.
Training for a 5K adds the variable of added calorie burns from my runs, so I need to monitor and account for those, too.
Running: I took a short, fast (for me) run on Jan. 12, covering 3/4 mile in 8:32 (5.27 mph, pace of 11:23).
Today's outing marks my longest nonstop distance since I returned to running: 2.64 miles in 33:40 (4.7 mph., pace of 12:45). This improves over my previous post-return distance record by 0.41 mile. I am now less than a half-mile short of a 5K distance.
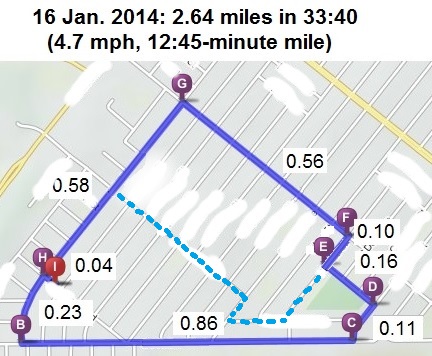
My route (plotted using Mapquest) is above, with street names erased. The light blue dotted line represents my original planned trajectory, which would have given me a 2.55-mile route; I had taken a wrong turn. Two long hills fall between points B and C and my climb continued up to point E, since the area in green represents a water tower. The rest of my run had some rises and dips, but they were negligible compared to my tower climb.
In addition to increasing my calories last night, I had prepared a calorie- and energy-dense breakfast of oatmeal, raisins, and walnuts. Temperature was 49F breezy degrees when I set out in a medium-weight athletic pant, longsleeved cycling jersey, and Polartec sports vest. I felt chilled but not too cold for the first quarter-mile and from then on felt comfortable. Most of my run was in full sun; aside from the start I felt chilly only when running in the shade. Unlike with other runs, I did not need my table fan to cool me down after I had finished.
For comparison, back in 2002 my longest outdoor run had been 12.5 miles at a pace of 13:08; two weeks later I had run 11 miles at a pace of 12:39. I had also been 12 years younger.
Today also marks Day 7 of my planking program. Yesterday's basic plank went for 40 seconds. Today I shoot for 45.
30-day planking plan:
http://shrinkingjeans.net/files/2013/10/planksgiving-01.png
Onward and healthward. Steady as she goes.
(Edited to attempt to resize image -- .png files don't seem to show up here.)
Weight: My maximum weight fluctuation in either direction, up or down from my goal, came to 1.5 pounds. I had last weighed 151.5 back on Dec. 23, 2013. I had dropped to 148.5 on Jan. 8, 2014, and increased my calories to keep it from dropping further. Today's weight of 150.5 (not shown), up a pound from yesterday, reflects in part my highest net calorie consumption (1559) and my third-highest total calorie consumption (1941) in maintenance. In addition, yesterday's meal out had increased my sodium intake. I had also focused last night on eating more, in preparation for today's long (for me) run.
Exercise Calories Burned: I took two rest days (0 calories burned) over the past 30 days and otherwise kept mostly to an approximate 400-calorie daily burn, representing an hour on the mini-bike. Exceptions include up-ticks for running days and yard work performed in addition to the bike; and lesser burns for a low-burn walk, a short run, and a 30-minute bike session. Average exercise calories burned (including rest days) equaled 377/day.
Total and Net Calories Consumed: Total calories averaged 1727/day and ranged from 1321 on New Year's Day (the day of my second-lowest-burn workout) to 2019 on Jan. 12 (which also marked a slightly higher-than-average calorie burn from exercise). Net calories (total calories minus exercise calories burned) averaged 1350/day and ranged from 944 to 1559. With MFP's maintenance set at 1600 net, however, that indicates undereating on my part.
Dividing the month into two equal sections of 15 days each shows an adjustment as I learn to tweak my consumption. Increased daily average consumption is negligible for total calories (1721/day for the first half, 1732/day for the second half), but is much more pronounced for net calories (1299/day for the first half, 1400/day for the second half, an almost 8 percent increase).
Also interesting is the drop in my weight coincident with increased net calorie consumption. Again dividing the 30 days into two equal parts, my average weight comes to 150.63 for the first half and 149.93 for the second half. The rises and drops in the graph demonstrate that nicely.
That said, I am still eating below maintenance. On the other hand, I don't vouch for complete accuracy in calories eaten and burned and I give myself some wiggle room there. My tweaking continues, but I am very happy with the weight range I'm in. My recognition of hunger signals has also been improving. Put simply, if I feel hungry I eat -- after checking with my body and with my macros to hone in on just what type of food I'm really hungry for.
Body Composition: I did not take measurements on Dec. 17, 2013, the day I reached my goal weight; but I had taken them on Nov. 20. New measurements taken on Jan. 12, 2014 showed an additional 1.25 inches lost. According to my calipers, my body fat percentage has now dropped from 27.6 percent (the middle of the "ideal" range for a woman my age) to 25.9 percent, placing me at the low end of "ideal." Lower than that will move me into the "lean" range.
Source: Accu-Measure
The last time I had fallen into the "lean" range, I was 43 and my body fat had dropped to 18.8 percent. I learned my lesson when an evening stroll almost gave me a case of hypothermia and my face and hands had literally turned blue. Thanks but no thanks.
Training for a 5K adds the variable of added calorie burns from my runs, so I need to monitor and account for those, too.
Running: I took a short, fast (for me) run on Jan. 12, covering 3/4 mile in 8:32 (5.27 mph, pace of 11:23).
Today's outing marks my longest nonstop distance since I returned to running: 2.64 miles in 33:40 (4.7 mph., pace of 12:45). This improves over my previous post-return distance record by 0.41 mile. I am now less than a half-mile short of a 5K distance.
My route (plotted using Mapquest) is above, with street names erased. The light blue dotted line represents my original planned trajectory, which would have given me a 2.55-mile route; I had taken a wrong turn. Two long hills fall between points B and C and my climb continued up to point E, since the area in green represents a water tower. The rest of my run had some rises and dips, but they were negligible compared to my tower climb.
In addition to increasing my calories last night, I had prepared a calorie- and energy-dense breakfast of oatmeal, raisins, and walnuts. Temperature was 49F breezy degrees when I set out in a medium-weight athletic pant, longsleeved cycling jersey, and Polartec sports vest. I felt chilled but not too cold for the first quarter-mile and from then on felt comfortable. Most of my run was in full sun; aside from the start I felt chilly only when running in the shade. Unlike with other runs, I did not need my table fan to cool me down after I had finished.
For comparison, back in 2002 my longest outdoor run had been 12.5 miles at a pace of 13:08; two weeks later I had run 11 miles at a pace of 12:39. I had also been 12 years younger.
Today also marks Day 7 of my planking program. Yesterday's basic plank went for 40 seconds. Today I shoot for 45.
30-day planking plan:
http://shrinkingjeans.net/files/2013/10/planksgiving-01.png
Onward and healthward. Steady as she goes.
(Edited to attempt to resize image -- .png files don't seem to show up here.)
0
Replies
-
I am a fellow perfectionist...I love to follow charts, graphs, and other data to pinpoint my weight loss at all times to try to make the most of it.
So, I very much enjoyed this post") I hope I can keep my fluctuations as contained as that when I reach maintenance one day...seems like only a dream still! 0
I hope I can keep my fluctuations as contained as that when I reach maintenance one day...seems like only a dream still! 0 -
Very cool, thanks for sharing! I wish I kept up with my data as well as you do. Also, you are doing great!0
-
Extremely impressive love the charts 0
-
Very very helpful!!! Thank you so much for this!!! I am heading into maintenance starting next week and this is very great information! Please keep us updated if you can! I really appreciate the graphs and analytical information!!!0
-
Given that I usually only use MFP on my iPhone, this may be a question out of ignorance, but were you able to do your charts within MFP?
Thanks!0 -
Congratulations on your hard work and I must say I am completely amazed with your granular detail on the graphs. Very Impressive!!!!!!!0
-
Thanks for sharing!
I'vealso been maintaining a monh with a stable weight.
But I don't have graphs!0 -
I, like you, seem to be addicted to charts and graphs. I joined in with my communities 12 week body transformation challenge a few weeks ago and have been keeping weekly track of my lifting and body stats in excel with graphs.. But I've only been tracking my calories in MFP, not excel. You just gave me something to do today 0
-
Things I wish I did from the beginning:
-Took before and after pictures
-Kept track and graphed things
Very pretty.0 -
This is is crazy dedication, nice job.0


This discussion has been closed.
Categories
- All Categories
- 1.4M Health, Wellness and Goals
- 396.8K Introduce Yourself
- 44.2K Getting Started
- 260.9K Health and Weight Loss
- 176.3K Food and Nutrition
- 47.6K Recipes
- 232.8K Fitness and Exercise
- 450 Sleep, Mindfulness and Overall Wellness
- 6.5K Goal: Maintaining Weight
- 8.7K Goal: Gaining Weight and Body Building
- 153.3K Motivation and Support
- 8.3K Challenges
- 1.3K Debate Club
- 96.5K Chit-Chat
- 2.6K Fun and Games
- 4.5K MyFitnessPal Information
- 16 News and Announcements
- 18 MyFitnessPal Academy
- 1.4K Feature Suggestions and Ideas
- 3.1K MyFitnessPal Tech Support Questions