Welcome to Debate Club! Please be aware that this is a space for respectful debate, and that your ideas will be challenged here. Please remember to critique the argument, not the author.
Correlation, Causation and County Maps
Replies
-
Population density.

Chicago is a fine city, too. Your waterfront is for the people, as it should be. Reminds me of the grand plan of Central Park in New York. Engineering spaces for the people. Whatever happened to those Neo-Classical ideals? The stock market crash?0 -
-
More on Adams county, Illinois.
http://www.countyhealthrankings.org/app/illinois/2015/rankings/adams/county/outcomes/overall/snapshot
0 -
jmbmilholland wrote: »Ah, yes @senecarr I can get behind the possibility of different treatment, coming from a visible minority, different treatment, and the stresses around that. In Canada we have a poor record on how we treated the native populations.
I've been thinking through your race vs. ethnic origin question, and I have come to the conclusion that my mind is not smart enough to handle it, because they seem to blur into each other and both change with changing cultural constructions and attitudes, whether scientifically defined as with race or community defined as with ethnic origin. Ugh! It's especially challenging when you look at the so-called "Hispanic" demographic; for example, to take two examples where the Hispanic demographic is by far the most dominant, the Texas county Hidalgo is on the heavy end of the spectrum (34% obese), while Miami-Dade is on the light end of the spectrum (21% obese). Miami Dade has a large Cuban population and probably many other Hispanic groups; I am guessing Hidalgo is primarily Mexican. Hispanics from all countries can range from Caucasian to African to Native American (which might be lumped in with Asians...?). How does a demographer even tease through that? Racially, a Hispanic could be the same as a "white" or a "black" but ethnic origin, which encompasses culture, there are huge differences.
At any rate, looking at Indiana, the two heaviest counties are very rural, somewhat hilly, in the southern part of the state--with a culture/ethnic origin that is comparable to Appalachian areas. And of course a very poor, slandered ("hillbilly"), mistreated demographic. Fun fact: John Mellancamp's "Small Town" is about Seymour, Indiana, which is in the heaviest Indiana county. Of course, then you also have one of the two thinnest Indiana counties located in the hilly south, Monroe, which encompasses Bloomington and Indiana University.
Demographers probably ask respondents to self-identify. I am the grandmother to a mixed-race child, so my whole family is sensitive to this. My granddaughter explained it this way. A person is identified as black in the US even if they are 1/8 black. So my daughter feels slighted, as if she doesn't exist, even though my granddaughter carries half her heritage from the German/Scottish side.
The "race" map I've been copying separates "Asian" out as red. I notice a fairly large Asian contingent in the US cities, pretty concentrated right now. Give it a generation or two and that will change I bet.0 -
0 -
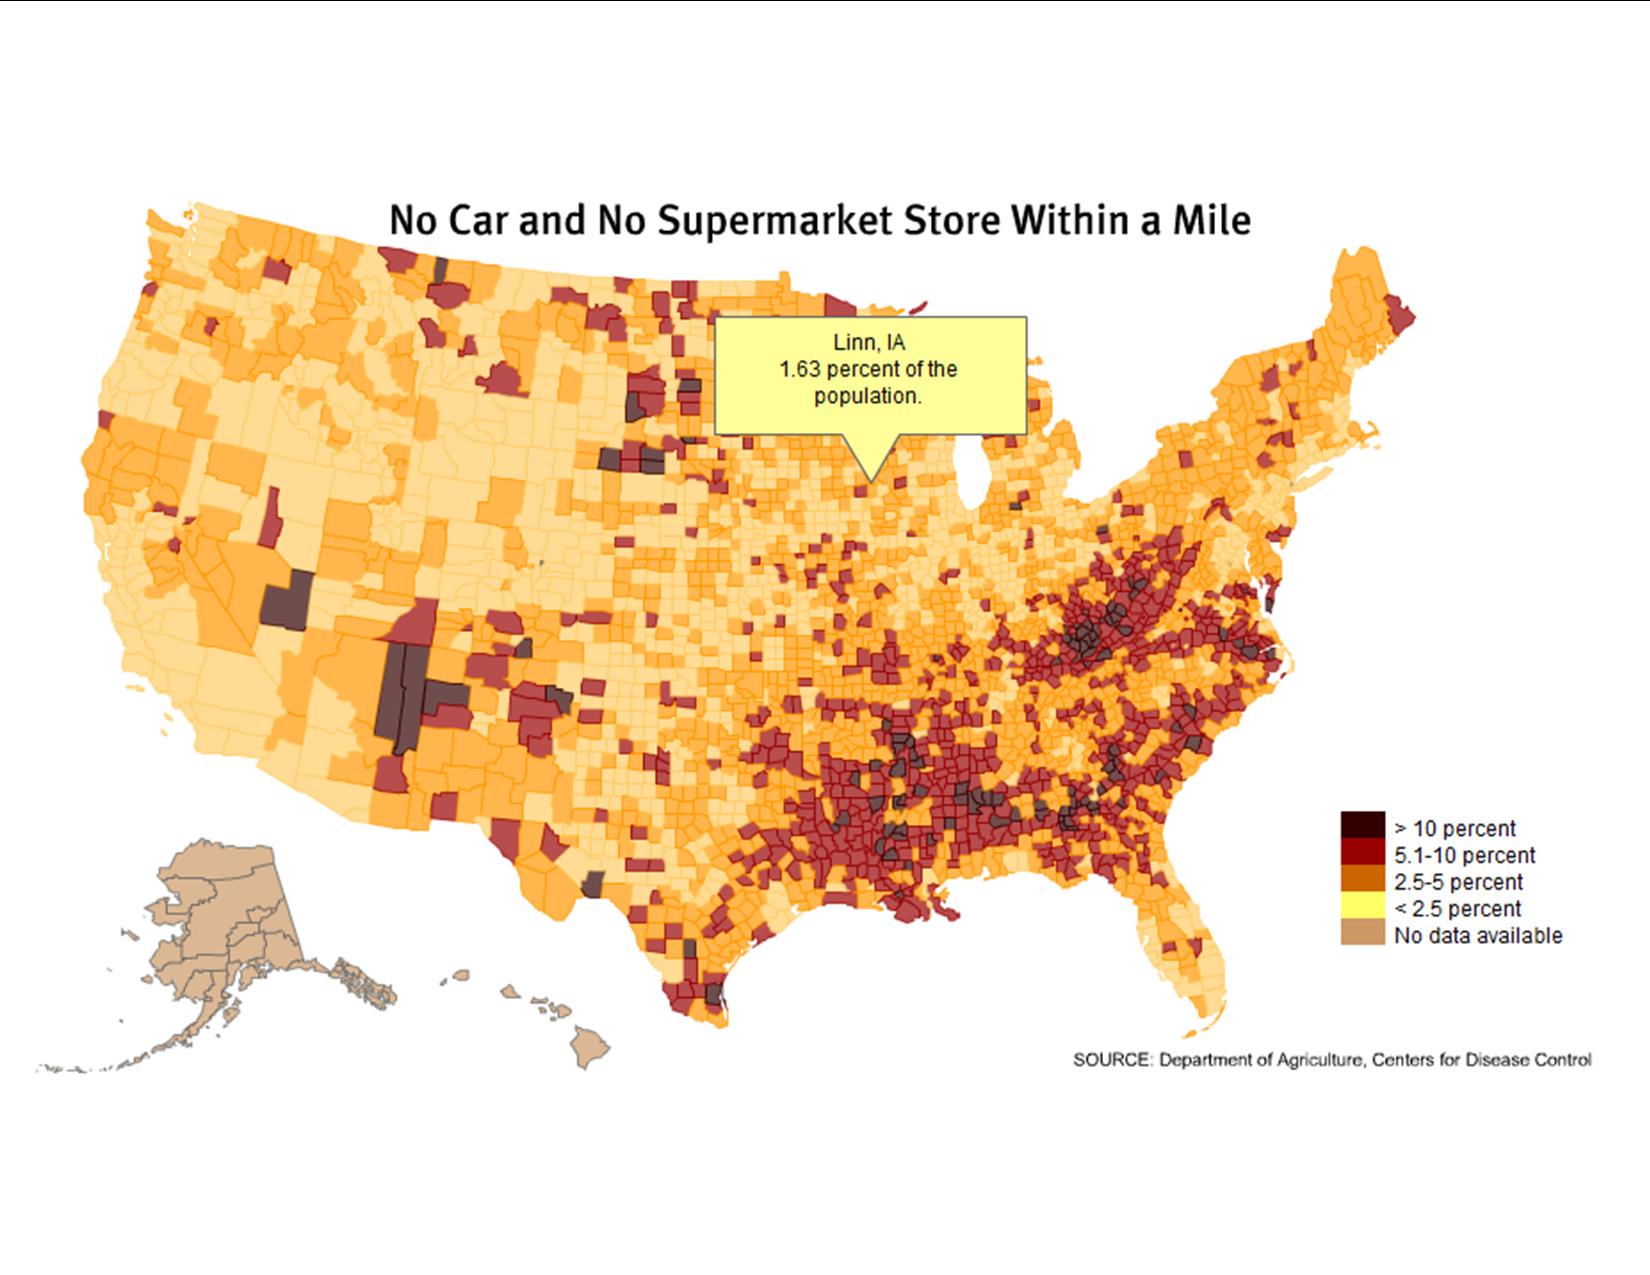
I just found a very cool interactive map. Well geek cool. You might have figured out by now that I love my maps.
http://www.ers.usda.gov/data-products/food-environment-atlas/go-to-the-atlas.aspx0 -
jmbmilholland wrote: »Ah, yes @senecarr I can get behind the possibility of different treatment, coming from a visible minority, different treatment, and the stresses around that. In Canada we have a poor record on how we treated the native populations.
I've been thinking through your race vs. ethnic origin question, and I have come to the conclusion that my mind is not smart enough to handle it, because they seem to blur into each other and both change with changing cultural constructions and attitudes, whether scientifically defined as with race or community defined as with ethnic origin. Ugh! It's especially challenging when you look at the so-called "Hispanic" demographic; for example, to take two examples where the Hispanic demographic is by far the most dominant, the Texas county Hidalgo is on the heavy end of the spectrum (34% obese), while Miami-Dade is on the light end of the spectrum (21% obese). Miami Dade has a large Cuban population and probably many other Hispanic groups; I am guessing Hidalgo is primarily Mexican. Hispanics from all countries can range from Caucasian to African to Native American (which might be lumped in with Asians...?). How does a demographer even tease through that? Racially, a Hispanic could be the same as a "white" or a "black" but ethnic origin, which encompasses culture, there are huge differences.
At any rate, looking at Indiana, the two heaviest counties are very rural, somewhat hilly, in the southern part of the state--with a culture/ethnic origin that is comparable to Appalachian areas. And of course a very poor, slandered ("hillbilly"), mistreated demographic. Fun fact: John Mellancamp's "Small Town" is about Seymour, Indiana, which is in the heaviest Indiana county. Of course, then you also have one of the two thinnest Indiana counties located in the hilly south, Monroe, which encompasses Bloomington and Indiana University.
Illinois sounds similar to Indiana, but one thing I think is true is that the counties that have the worst stats skew older (which is not unrelated to some of the issues that rural counties in certain parts of the southern mid-west may have). They also have somewhat higher poverty rates than the state as a whole (and are much whiter, but Chicago distorts that stat anyway).
Your university counties would be younger, and even with childhood obesity being an issue younger people tend to be thinner.0 -
-
I'm from California (the boot county in the middle - Fresno) and it is interesting to note that there's worse outcomes in this area, which is also one of the poorest in the state.
Coincidentally, it is also one of the last areas where property values are not out of control.0 -
Heavier as we get older? Yup, the baby boomers (zoomers) will dominate demographic trends for a few years yet.0
-
More on Adams county, Illinois.
http://www.countyhealthrankings.org/app/illinois/2015/rankings/adams/county/outcomes/overall/snapshot
Hey that is where I live (since June last year).0 -
Happy Canadians with publicly funded health care.0
-
I wonder how comparing counties with high numbers of retirees vs. not would look, although people who move to Florida to retire are probably relatively well-off, which is a contrary statistic. Aging rural counties with no reason to keep younger people in the area (and higher than average poverty rates) are going to be different, even if the relatively older population is a factor.0 -
lemurcat12 wrote: »
I wonder how comparing counties with high numbers of retirees vs. not would look, although people who move to Florida to retire are probably relatively well-off, which is a contrary statistic. Aging rural counties with no reason to keep younger people in the area (and higher than average poverty rates) are going to be different, even if the relatively older population is a factor.
Plus walking around Disney is pretty good so long as you don't have too many Mickey Mouse ice cream bars.0 -
lemurcat12 wrote: »
I wonder how comparing counties with high numbers of retirees vs. not would look, although people who move to Florida to retire are probably relatively well-off, which is a contrary statistic. Aging rural counties with no reason to keep younger people in the area (and higher than average poverty rates) are going to be different, even if the relatively older population is a factor.
I did post an "over 55" county map of Illinois up-thread. Both Adams and Christian have a healthy share. But even though Adams has more obese, it's overall health factors aren't that bad. I'm thinking that there a fair number of fat and happy senior citizens (Santa Claus, Snowbirds).
Perhaps obesity in younger adults is a larger risk factor in poor health outcomes.0 -
Generally speaking also, major urban centers seem to be better off than the rural areas. I'm looking at the northern edge of the state. Is it access to facilities, services?
Political Landscape
Elderly
Obesity
Racial Makeup and Population Density 0
0 -
0
-
jmbmilholland wrote: »Ah, yes @senecarr I can get behind the possibility of different treatment, coming from a visible minority, different treatment, and the stresses around that. In Canada we have a poor record on how we treated the native populations.
I've been thinking through your race vs. ethnic origin question, and I have come to the conclusion that my mind is not smart enough to handle it, because they seem to blur into each other and both change with changing cultural constructions and attitudes, whether scientifically defined as with race or community defined as with ethnic origin. Ugh! It's especially challenging when you look at the so-called "Hispanic" demographic; for example, to take two examples where the Hispanic demographic is by far the most dominant, the Texas county Hidalgo is on the heavy end of the spectrum (34% obese), while Miami-Dade is on the light end of the spectrum (21% obese). Miami Dade has a large Cuban population and probably many other Hispanic groups; I am guessing Hidalgo is primarily Mexican. Hispanics from all countries can range from Caucasian to African to Native American (which might be lumped in with Asians...?). How does a demographer even tease through that? Racially, a Hispanic could be the same as a "white" or a "black" but ethnic origin, which encompasses culture, there are huge differences.
At any rate, looking at Indiana, the two heaviest counties are very rural, somewhat hilly, in the southern part of the state--with a culture/ethnic origin that is comparable to Appalachian areas. And of course a very poor, slandered ("hillbilly"), mistreated demographic. Fun fact: John Mellancamp's "Small Town" is about Seymour, Indiana, which is in the heaviest Indiana county. Of course, then you also have one of the two thinnest Indiana counties located in the hilly south, Monroe, which encompasses Bloomington and Indiana University.
Demographers probably ask respondents to self-identify. I am the grandmother to a mixed-race child, so my whole family is sensitive to this. My granddaughter explained it this way. A person is identified as black in the US even if they are 1/8 black. So my daughter feels slighted, as if she doesn't exist, even though my granddaughter carries half her heritage from the German/Scottish side.
The "race" map I've been copying separates "Asian" out as red. I notice a fairly large Asian contingent in the US cities, pretty concentrated right now. Give it a generation or two and that will change I bet.
Oh, that struck a chord in my heart about your daughter feeling a little like she doesn't exist. I thought about the women we call the "shadow women" in our family history--a mysterious member of the Lenape tribe, an Irish girl who came over during the famine as an indentured servant, married a wealthy landowner, and died in childbirth...all the women whose history was suppressed and lost. It seems like I've been seeing more forms that say "check all that apply" so people can proudly acknowledge all aspects of their heritage. It means a lot. Your granddaughter has a variety of rich heritages to learn about and treasure. I took a cooking school course in New Orleans a few years ago, and since then have become increasingly interested in old-school Southern and African American cooking, which is experiencing a renaissance in the US.0 -
Ah, my granddaughter's heritage is straight from East Africa. Right now her interest is "meh". Meanwhile, my daughter and I have collected a few recipes that she might be interested in later, like Injera.0
-
The US has started including "two or more races" or "mixed race" on official documents like the Census. It's been pretty recent but I agree that it's a good thing.0
-
Ah, my granddaughter's heritage is straight from East Africa. Right now her interest is "meh". Meanwhile, my daughter and I have collected a few recipes that she might be interested in later, like Injera.
One of my best friends from high school was Ethiopian. Her job was to make their injera--I just remember seeing this huge, bubbling mass of sourdough rising out of the bowl, but at the time, I had no curiosity about foods from other cultures. They also had the bottles of traditional smoked mead. Now that I have sourdough living in my fridge and cabbage or vinegar fermenting on my counter for much of the year, I realize what a loss it was that we would go out to Pizza Hut instead of staying and eating with her parents.0 -
jmbmilholland wrote: »Ah, yes @senecarr I can get behind the possibility of different treatment, coming from a visible minority, different treatment, and the stresses around that. In Canada we have a poor record on how we treated the native populations.
I've been thinking through your race vs. ethnic origin question, and I have come to the conclusion that my mind is not smart enough to handle it, because they seem to blur into each other and both change with changing cultural constructions and attitudes, whether scientifically defined as with race or community defined as with ethnic origin. Ugh! It's especially challenging when you look at the so-called "Hispanic" demographic; for example, to take two examples where the Hispanic demographic is by far the most dominant, the Texas county Hidalgo is on the heavy end of the spectrum (34% obese), while Miami-Dade is on the light end of the spectrum (21% obese). Miami Dade has a large Cuban population and probably many other Hispanic groups; I am guessing Hidalgo is primarily Mexican. Hispanics from all countries can range from Caucasian to African to Native American (which might be lumped in with Asians...?). How does a demographer even tease through that? Racially, a Hispanic could be the same as a "white" or a "black" but ethnic origin, which encompasses culture, there are huge differences.
The census collects ethnic origin information and the basic racial information. Because Hispanic complicates it (about half of Hispanics self-identify as "white," many others as "other," some obviously as Asian or African-American), the current usual census breakdown either adds up to more than 100% (white-black-Hispanic) or is done so as to break out Hispanics (non-Hispanic white, non-Hispanic black, and Hispanic).
I had a case that involved a lot of arguments about demographics, so I got to spend a lot of time with the census and stuff like this.0 -
This is how Canada handled it on our National Household Survey.
'What were the ethnic or cultural origins of this person's ancestors?' A note provided above the question stated that 'this question collects information on the ancestral origins of the population and provides information about the composition of Canada's diverse population.' Below the question, a second note indicated that 'an ancestor is usually more distant than a grandparent.'
The 2011 NHS Form N1 question provided the following 28 examples, in order of appearance: Canadian, English, French, Chinese, East Indian, Italian, German, Scottish, Irish, Cree, Mi'kmaq, Salish, Métis, Inuit, Filipino, Dutch, Ukrainian, Polish, Portuguese, Greek, Korean, Vietnamese, Jamaican, Jewish, Lebanese, Salvadorean, Somali, and Colombian. In contrast, the N2 form provided 12 examples, starting with Canadian Aboriginal groups. The examples, in order of appearance, were: Cree, Ojibway, Mi'kmaq, Salish, Dene, Blackfoot, Inuit, Métis, Canadian, French, English, and German.
https://www12.statcan.gc.ca/nhs-enm/2011/ref/guides/99-010-x/99-010-x2011006-eng.cfm
And data from our 2011 survey. 20% of our population is made up of immigrants.
https://www12.statcan.gc.ca/nhs-enm/2011/as-sa/99-010-x/99-010-x2011001-eng.cfm0 -
Canadian data visualizations are so suckyyyy compared to the US. C'mon Open Data people; give me more!

0 -

0 -
Here's an income one for you (I'm guessing you will like it): http://www.census.gov/censusexplorer/censusexplorer.html
The IL counties that do poorly on obesity also are on the low income side, but the problem is that's distorted by the fact they are quite rural.
The most interesting information is based on census tract, and we don't have the obesity information for that (I am positive that in Chicago it would track the low income areas, but that's hard to separate out from the minority stats, at least with certain areas).
The income inequality it shows in places like Chicago isn't surprising if you know anything about the area, but extremely dramatic.0 -
oooooooo, it zooms! What I remember most driving from Chicago to my friend's place in Madison, is the incredible (to Canadian eyes) urban sprawl. It's wall to wall urbanisation right across the border in to Wisconsin.0
-
jmbmilholland wrote: »Ah, yes @senecarr I can get behind the possibility of different treatment, coming from a visible minority, different treatment, and the stresses around that. In Canada we have a poor record on how we treated the native populations.
I've been thinking through your race vs. ethnic origin question, and I have come to the conclusion that my mind is not smart enough to handle it, because they seem to blur into each other and both change with changing cultural constructions and attitudes, whether scientifically defined as with race or community defined as with ethnic origin. Ugh! It's especially challenging when you look at the so-called "Hispanic" demographic; for example, to take two examples where the Hispanic demographic is by far the most dominant, the Texas county Hidalgo is on the heavy end of the spectrum (34% obese), while Miami-Dade is on the light end of the spectrum (21% obese). Miami Dade has a large Cuban population and probably many other Hispanic groups; I am guessing Hidalgo is primarily Mexican. Hispanics from all countries can range from Caucasian to African to Native American (which might be lumped in with Asians...?). How does a demographer even tease through that? Racially, a Hispanic could be the same as a "white" or a "black" but ethnic origin, which encompasses culture, there are huge differences.
At any rate, looking at Indiana, the two heaviest counties are very rural, somewhat hilly, in the southern part of the state--with a culture/ethnic origin that is comparable to Appalachian areas. And of course a very poor, slandered ("hillbilly"), mistreated demographic. Fun fact: John Mellancamp's "Small Town" is about Seymour, Indiana, which is in the heaviest Indiana county. Of course, then you also have one of the two thinnest Indiana counties located in the hilly south, Monroe, which encompasses Bloomington and Indiana University.
Oh, and as a corollary to that, while most cities in Texas have a high Mexican Hispanic population as opposed to Hispanics originally from other countries, there's also a big divide as to which part of Mexico they come from - and the different areas of Mexico have food cultures as diverse as the different regions of Italy.
Dallas, for example, has very few people that originated from the Oaxaca region and it's been almost impossible to find that region's food here for that reason. In fact, a restaurant just opened last month with some traditional Oaxacan dishes and I can't wait to try it out. Houston, on the other hand has more of a blend. Not sure about Austin or San Antonio.0


This discussion has been closed.
Categories
- All Categories
- 1.4M Health, Wellness and Goals
- 398.1K Introduce Yourself
- 44.7K Getting Started
- 261K Health and Weight Loss
- 176.4K Food and Nutrition
- 47.7K Recipes
- 233K Fitness and Exercise
- 462 Sleep, Mindfulness and Overall Wellness
- 6.5K Goal: Maintaining Weight
- 8.7K Goal: Gaining Weight and Body Building
- 153.5K Motivation and Support
- 8.4K Challenges
- 1.4K Debate Club
- 96.5K Chit-Chat
- 2.6K Fun and Games
- 4.8K MyFitnessPal Information
- 12 News and Announcements
- 21 MyFitnessPal Academy
- 1.5K Feature Suggestions and Ideas
- 3.2K MyFitnessPal Tech Support Questions