Oh look
Options

DatMurse
Posts: 1,501 Member

 [
[ 0
Replies
-
Bump to read later.
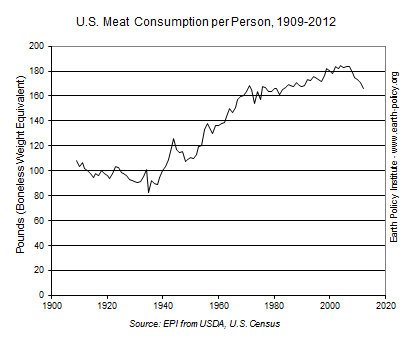
ETA: Is that 200 pounds of boneless meat per person in a year? I'm pretty sure I eat way more than that not including the 8 dozen eggs every week.0 -
MEAT FTW!!!!! I think what matters when it comes to meat is where did you get it and what has it been eating.. If I could have a supply of free range chickens, all natural grass fed beef, and some wild fresh salmon I'd be a happy happy happy man..0
-
Note the different scales on the x axis. They appear completely unrelated.0
-
oh wellNote the different scales on the x axis. They appear completely unrelated.0 -
Bump to read later.
ETA: Is that 200 pounds of boneless meat per person in a year? I'm pretty sure I eat way more than that not including the 8 dozen eggs every week.
eggs are not meat0 -
um might want to show a graph comparison of something like the use of antibiotics or medical technology...unless this is a joke post which i often dont get0
-
Note the different scales on the x axis. They appear completely unrelated.
Just look at the gradient for the same period, then. The trend is still life expectancy increasing with increased meat consumption.
However, correlation isn't causation; there's medical advances, a more abundant supply of food, cheaper food, even provision of food stamps to take into account.
But the fact one shows a different range to the other doesn't instantly negate any of the findings.0 -
What's the life expectancy of an egg?0
-
Note the different scales on the x axis. They appear completely unrelated.
Just look at the gradient for the same period, then. The trend is still life expectancy increasing with increased meat consumption.
However, correlation isn't causation; there's medical advances, a more abundant supply of food, cheaper food, even provision of food stamps to take into account.
But the fact one shows a different range to the other doesn't instantly negate any of the findings.
Life expectancy was increasing at about the same rate even when meat consumption was declining.0 -
What's the life expectancy of an egg?
depends are you boiling the egg or letting it hatch. Is it a chicken egg, a cobra egg, a fish egg, an unfertilized mammalian egg, or a rare amazon tree frog egg? Context man context!0 -
I call your meat consumption vs. life expectancy and raise you a # of pirates vs. global temperature.
 0
0 -
it ends at 2000Note the different scales on the x axis. They appear completely unrelated.
Just look at the gradient for the same period, then. The trend is still life expectancy increasing with increased meat consumption.
However, correlation isn't causation; there's medical advances, a more abundant supply of food, cheaper food, even provision of food stamps to take into account.
But the fact one shows a different range to the other doesn't instantly negate any of the findings.
Life expectancy was increasing at about the same rate even when meat consumption was declining.0 -
Interesting that meat consumption is trending down as life expectancy is trending up.0
-

thank god for corn0 -

thank god for corn
thank good for GMO's!!0 -
So if we want to kill people off we ban meat?0
-

thank god for corn
thank good for GMO's!!
stop the genetically modified trees from growing too fast!0 -
So if we want to kill people off we ban meat?
or if you kill people meat demand will go down0 -
Interesting that meat consumption is trending down as life expectancy is trending up.
No it isn't. The life expectancy graph ends at 2000. The meat consumption one a decade later. Like I said, compare the same period on both graphs.
And as has already been posted, that doesn't actually mean a great deal in isolation, anyhow. But at least I compared like with like.0 -
 0
0 -

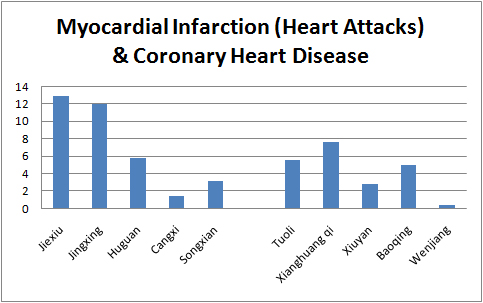
heart disease is the leading cause of death in the country.
people need to smoke more so they get lung cancer to bring it down0 -
Oh look, it's someone conflating correlation and causality again.
Except this time, there isn't even correlation.0 -
hmmm... meat and corn will kill me. got it.0
-
Bump to read later.
ETA: Is that 200 pounds of boneless meat per person in a year? I'm pretty sure I eat way more than that not including the 8 dozen eggs every week.
eggs are not meat
Then what are they, exactly? What food group do they fall in?0 -
hmmm... meat and corn will kill me. got it.

 0
0 -
However, correlation isn't causation; there's medical advances, a more abundant supply of food, cheaper food, even provision of food stamps to take into account.
^^^ Yup. More medical screenings, diagnostic testing, better understanding of disease processes, increased focus on preventive care, health insurance, access to care, better understanding of nutrition, vitamins, food safety regulations, work place safety regulations...0 -
So you're trying to tell me that life expectancy isn't trending up, even though it's not listed on the OP's chart?Interesting that meat consumption is trending down as life expectancy is trending up.
No it isn't. The life expectancy graph ends at 2000. The meat consumption one a decade later. Like I said, compare the same period on both graphs.
And as has already been posted, that doesn't actually mean a great deal in isolation, anyhow. But at least I compared like with like.0 -
0
-
So you're trying to tell me that life expectancy isn't trending up, even though it's not listed on the OP's chart?Interesting that meat consumption is trending down as life expectancy is trending up.
No it isn't. The life expectancy graph ends at 2000. The meat consumption one a decade later. Like I said, compare the same period on both graphs.
And as has already been posted, that doesn't actually mean a great deal in isolation, anyhow. But at least I compared like with like.
No. I'm telling you to compare equal periods on the two graphs. Whilst your conclusions may be accurate or inaccurate, at least you'll be following good practice by taking information from the same timescale.0 -
I learned how to read charts, circa sixth grade.No. I'm telling you to compare equal periods on the two graphs. Whilst your conclusions may be accurate or inaccurate, at least you'll be following good practice by taking information from the same timescale.0
This discussion has been closed.
Categories
- All Categories
- 1.4M Health, Wellness and Goals
- 396.8K Introduce Yourself
- 44.2K Getting Started
- 260.9K Health and Weight Loss
- 176.3K Food and Nutrition
- 47.6K Recipes
- 232.8K Fitness and Exercise
- 452 Sleep, Mindfulness and Overall Wellness
- 6.5K Goal: Maintaining Weight
- 8.7K Goal: Gaining Weight and Body Building
- 153.3K Motivation and Support
- 8.3K Challenges
- 1.3K Debate Club
- 96.5K Chit-Chat
- 2.6K Fun and Games
- 4.5K MyFitnessPal Information
- 16 News and Announcements
- 18 MyFitnessPal Academy
- 1.4K Feature Suggestions and Ideas
- 3.1K MyFitnessPal Tech Support Questions


