The Hacker's Diet & ESMA - statistics/Excel nerds needed

sparklefrogz
Posts: 281 Member
So I'm reading The Hacker's Diet, specifically the part called "Signal & Noise" (http://www.fourmilab.ch/hackdiet/e4/). I don't have a strong statistics background (only made it through Intro to Stats in uni) so I want to make sure I understand some of what Walker is saying when he talks about exponentially smoothed moving averages.
1. First, just a quick comprehension check. He says ESMA is calculated by giving data points a weight equal to successive powers of the smoothing factor. If I'm understanding Walker correctly, he means that with a smoothing factor of .9, my weighting should look like this:
today = .9
yesterday = .81
the day before = .729
the day before that = .6561
and so on.
Is that correct? (I have seen that Wikipedia gives what looks like a different equation than this; I'm ignoring that for now and sticking with just grasping what Walker is saying.)
2. He implies that ESMA handles the lagging trendline issue that is created by unweighted moving averages, but I don't understand how. I don't know if I'm misinterpreting one of his graphs in this chapter or what.
3. He states that with smoothing factors between .5 and .9, the weighting means you can effectively include all historical data in your calculation. He seems to imply this as some sort of benefit, but doesn't elucidate why. If I have a large spreadsheet full of data, wouldn't it be better for CPU load to NOT have the ESMA for each date calculate ALL historical data? What benefits am I overlooking?
3A. I have a weight tracking spreadsheet that currently uses a 10 day moving average with today weighted at .9, yesterday at .8, and so on all the way to ten days ago at .1. Is there a formula I can use in Excel, or an existing public spreadsheet I can set up, that uses ESMA so I can compare the trends given by my existing spreadsheet versus Walker's suggestion? (I have tried his spreadsheets on his site, but they are for Excel 2003 and Excel 2010 doesn't like them much. They rely on a bunch of macros to function. I've also tried Googling ESMA spreadsheets, but I just get a lot of webpages related to stock trading, since that industry uses ESMA a lot apparently.)
4. Related Excel question: I know how to make Excel give me a best fit straight line for a scatter graph, and to display the equation for it too -- but how do I make Excel tell me the start and end point of that best fit line on the graph? (I know I can increase the granularity of the gridlines and zoom in on the chart and sort of guess, but I'd like Excel to spit out an exact number for me if possible.)
0
Replies
-
the general idea of EWMA (W = weighted, S = smoothed) is to diminish the effect of distant data falling off the sliding window. Without it the change in a simple moving average each day is simply the difference between today and the day at the opposite end of the window, which can be erratic.
He expands on the equations at http://www.fourmilab.ch/hackdiet/e4/pencilpaper.html#PencilMovingAverages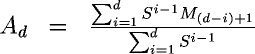
http://www.clinchem.org/content/43/4/594.long might help
I don't quite understand Q4 - what do you mean by start and end point ?0 -
the general idea of EWMA (W = weighted, S = smoothed) is to diminish the effect of distant data falling off the sliding window. Without it the change in a simple moving average each day is simply the difference between today and the day at the opposite end of the window, which can be erratic.
I don't quite understand Q4 - what do you mean by start and end point ?
Hey, thanks for that explanation; that was extraordinarily clear. My next question would be, Walker seems to imply that an ESMA with smoothing factor .5 to .9 that takes into account all historical data is better than a WMA. Is this because more data points makes it more accurate?
Regarding #4, here is a sample of my data:
What I'm trying to do is determine what point the best fit line "starts" and "ends" at on the graph.0 -
I use Trendweight.com. It does all the math for me. (And I have a Fitbit Aria wifi scale, so I don't even have to input my weight.)0
-
Using all of the data, rather than a sliding window, turns it into a geometric series and allows the simplification -This reformulation makes the operation of smoothing very intuitive. Every day, we take the old trend number Ad−1, calculate the difference between it and today's measurement Md, then add a percentage of that difference P to the old trend value obtain the new one.
Again it may be smoother because there is no step effect of something dropping off the end, old data simply becomes less significant each day as the weighting factor tends to zero.
Will fire up Excel and think about the line...0 -
on a simple line plot (as opposed to XY) the trend line is calculated by excel on the basis that the data points have x values 1,2,3,4....
so to calculate the y value of the left hand end of the line use x=1 in the trend line equation and x=N for the other end.
edit - if you add a 1,2,3...... column to your data as an index you can use SLOPE and INTERCEPT functions to determine the trend line in Excel and calculate the end points.0 -
yarwell,
Thanks for taking the time to explain this to me, and the links you provided. I think I grasp this a lot better now. The Clinical Chemistry study you linked flew mostly above my head, but I did get from it that EWMA detects smaller trends sooner -- which is good from an engineering standpoint if you want to control your weight. I had not got to the "pencil and paper" section of The Hacker's Diet yet, and it looks like there's some very clear explanations happening in there. I will go through that section before trying to make Excel do anything further, hah.
And swapping the dates out for actual numbers worked just as you said. Thanks for poking around Excel for me. (Excel 2010 actually has an option under Chart Tools > Layout > Trendline > More Options to show the equation for the best fit line on the graph itself; once I punch in the appropriate sequence indicator for the series it calculates perfectly.)
editorgrrl,
Thanks for the link to TrendWeight! I don't have either of the scales they support but I'm playing around with a FitBit account right now -- you can enter your weight manually on FitBit.com and then hook the account up to TrendWeight. I'm just trying to figure out how to get FitBit to let me enter past data points... (Edit: Never mind, found it. Now, off to play with this some more!)0

This discussion has been closed.
Categories
- All Categories
- 1.4M Health, Wellness and Goals
- 398.5K Introduce Yourself
- 44.7K Getting Started
- 261K Health and Weight Loss
- 176.4K Food and Nutrition
- 47.7K Recipes
- 233K Fitness and Exercise
- 462 Sleep, Mindfulness and Overall Wellness
- 6.5K Goal: Maintaining Weight
- 8.7K Goal: Gaining Weight and Body Building
- 153.5K Motivation and Support
- 8.4K Challenges
- 1.4K Debate Club
- 96.5K Chit-Chat
- 2.6K Fun and Games
- 4.8K MyFitnessPal Information
- 18 News and Announcements
- 21 MyFitnessPal Academy
- 1.5K Feature Suggestions and Ideas
- 3.2K MyFitnessPal Tech Support Questions