Analysis of the past month (including charts and data)
Replies
-
That looks great! I'm going to make one of my own now and try to analyse the plateau I just broke!
My only concern is that the BMR calculated by MFP is ONLY an estimate, and it may be more / less. Perhaps this will help me decide whether I'm more or less than my estimated BMR...
Edit: done... with moving average.
Interesting... my TOM came at the end of that period during the sudden rise. Impossible to say whether it was due to that though. Shows that I've got a discrepency between my predicted deficit and empirical deficit of about 2000 calories. Maybe that's due to come off soon ... it'll be better when I have a bit more data. This is fun!0 -
BMR accuracy is one variable I have thought of also. Last night I started to play with the data a little to see what I would have to change to make the recorded (I like your term of predicted better) and actual to match more closely. That led me to wonder what are all the possible reasons for the deviations. Here are some I can think of:
Fat loss / gain
Muscle loss / gain
Water loss / gain
BMR being wrong
Daily activity burn being wrong
Exercise burn being wrong
Calorie consumption being wrong
I think those are the variables. Everything else is really just behavioral aspects related to them (for example, calorie consumption being wrong could be because all calories are not recorded or the food databae is wrong).
Thoughts?0 -
Just trying to wrap my head around the data, here . . .
So your moving average deficit is taken from your food diary (the # in the Remaining row at the end of the day--adding the last 7 days and dividing by 7) correct?
And your moving average actual is determined by multiplying pounds lost by 35000/lb (also 7-day moving average)?
So you should be able to tell whether MFP's guess for your BMR is accurate/close/or completely off-base by how well your actual weight loss tracks with MFP's data, correct? I'm asking b/c I've wondered about that, too, and this seems like a cool way to get an empirical answer.That looks great! I'm going to make one of my own now and try to analyse the plateau I just broke!
My only concern is that the BMR calculated by MFP is ONLY an estimate, and it may be more / less. Perhaps this will help me decide whether I'm more or less than my estimated BMR...
Edit: done... with moving average.
Interesting... my TOM came at the end of that period during the sudden rise. Impossible to say whether it was due to that though. Shows that I've got a discrepency between my predicted deficit and empirical deficit of about 2000 calories. Maybe that's due to come off soon ... it'll be better when I have a bit more data. This is fun!0 -
For me, the chart is plotting 7 day moving averages of three items:
Planned daily deficit (1000 per day)
Expected daily deficit based on the MFP diary
Actual daily deficit based on weight difference multiplied by 3500
Lots of imperfection in the actual buy I believe must be useful per previous discussions. What I hope to do now is explain those imperfections and account for them so that the predicted amounts are reliable indicators of the actual amounts. In effect, this proves the effectiveness of my "tuning knobs" which are the adjustments I make in diet, exercise and nutrition in general.0 -
Just trying to wrap my head around the data, here . . .
So your moving average deficit is taken from your food diary (the # in the Remaining row at the end of the day--adding the last 7 days and dividing by 7) correct?
And your moving average actual is determined by multiplying pounds lost by 35000/lb (also 7-day moving average)?
So you should be able to tell whether MFP's guess for your BMR is accurate/close/or completely off-base by how well your actual weight loss tracks with MFP's data, correct? I'm asking b/c I've wondered about that, too, and this seems like a cool way to get an empirical answer.
All of this is right, except that the moving average is determined by multiplying by 3500/lb (not 35000) and yes it is also a moving day average.
This should be a good way to determine if MFP has your BMR right, but I think it is more effective over a period of 2 - 3 months with steady weight loss (hence my plateau throws it off). If you burn more than you think you should have, your BMR might be higher; if you burn less your BMR is lower.0 -
I set up the spreadsheet and back entered data to April 1. I don't have actual daily weights for that first week, so I just used my weekly weight. I'll post my graphs at the end of the month.
I want to track minutes of exercise (or calories burned? not sure) in cardio vs weights on a daily basis so that I can look at what happens to weight loss when I tweak those. I haven't added that to the spreadsheet yet--might do that later today.0 -
Yep - I started working on that today also - GMTAI set up the spreadsheet and back entered data to April 1. I don't have actual daily weights for that first week, so I just used my weekly weight. I'll post my graphs at the end of the month.
I want to track minutes of exercise (or calories burned? not sure) in cardio vs weights on a daily basis so that I can look at what happens to weight loss when I tweak those. I haven't added that to the spreadsheet yet--might do that later today. I want to do it because I back out my BMR calories during my period of exercise which is something I want to tweak. But... I gotta stop playing for now and get my car in for an oil change, get my hair cut, etc...... 0
 -
Ok, this is cool. Based on changes I know I made, I applied a few adjustments to the data at the point in time that I know I made them. For example, around the time of 3/24 I made two significant changes - 1) I began paying much closer attention to my nutrient targets by taking a vitamin supplement and lowering my sugar intake, and 2) increased the intensity of my exercise from 15-40 minute stints of Wii based exercise routines to hour long stints on my stationary recumbent bike.
So, I applied adjustments to the data to get the recorded and actual points to line up at about 3/24, and then dramatically increased the number of calories burned during exercise to the point that the lines track almost identically. And, interestingly enough, it appears that if I used MFP's calorie counts would be much more accurate than my HRM.
So, I am going to test my theory from here and begin to use MFP's calorie counts for 60 minute stationary bike workouts and see if the pattern continues. Note this is going to mean that the number of burned calories that I record is going to increase DRAMATICALLY from like 400 to 1600 per workout. If the patterns continue then I have to believe that is more accurate. If it doesn't, then I have to start looking at diet for the differences.
It sure is going to be an ego boost to see those kinds of numbers! :happy: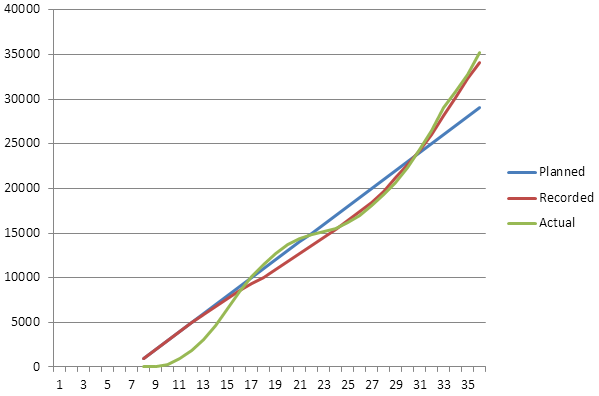 0
0 -
Woah! Wait a minute. Based on these assumptions, On days that I have worked out on the bike, I have burned twice the number of calories than I have eaten. Hard to imagine that is true, but the data is there. I lost about 8 pounds between 3/24 and now. That averages out to about 1800 calories per day burned. And if I look at my data with the adjustments made, it confirms those numbers.
Now, I just am not sure what to do. My instincts tell me to slow down the rate of loss a bit and eat more on the days I work out.
Gotta think about this some more.....0 -
I think the close match between your recorded (/predicted) / actual is impressively accurate and it suggests that your BMR is pretty much spot on.
I don't know if you can make the conclusion that if you switch to MFP calorie counts and the trend continues, then the MFP calorie counts are better adjusted than your HRM. It might be compensating for some other factor being out, such as the ones you mentioned previously. Best look into other difference factors (including diet) instead.
One thing that would be worth explaining is the wavey patterns at the beginning of your graph where you get off to a slow start and accelerate beyond your predicted deficit. This might be due to muscle mass loss rather than fat loss, which would produce that kind of acceleration due to it being more dense than fat (and yet calculated as fat).
In the short term, water retention or dehydration that lasts > 5 days may produce differences of a few thousand calories that would show up on your graph despite the 7 day moving average.
The only other thing that springs to mind at the moment is monitoring changes in macronutrients, fibre and water consumption and relating them to short-term changes in weight, and that would be very in-depth analysis indeed.0 -
Thank you for your input on this. I guess I am inclined to disgregard the beginning of the graph just because I made so many changes at the point of 3/24.
I think you have to be right that the differences have to be due to something other than the calories burned being off. For example, based on what I had written, if I exercised 60 minutes now at 1600 calories burned, I would need to eat 2200 callories for dinner! I just don't see myself doing that.
I will work to add some more metrics to the data. Basically, here is the data I have:
1. In MFP, I have all of the nutrients proivded for the period of time charted.
2. I started tracking water about mid-way (as previously noted).
3. As of today, I have a new scale that provides measurements of body fat, water, muscle and bone mass. I will begin charting those also.
4. I am also going to start tracking body measurements taken by tape measure.
I doubt the scale is all that accurate in the body metrics, but I think the differences between measurements will be useful. I may have to express this data in some other terms to get a common comparison - currently I am using calories, but can I express things like muscle mass difference in terms of calories?
Gotta do some more thinking....0 -
MFP's philosophy is that you eat back the calories you burn during exercise.
depending on the rate of work you do, and your fitness, exercise will burn more fat than glycogen. when you eat it back, your body first tops up the glycogen. high glycogen levels keep your metabolism high, and keeps your body from stopping doing the day to day repairs that it needs, but tends to put off if food is scarce.
Low glycogen encourages the body to cannibalise muscle.
When you lose muscle, you lose it at a rate of about a pound every 1500 calories deficit.0 -
Thank you - knowing the ratio of muscle loss to calorie deficie will help me a lot in my tracking. I have been concentrating on staying aerobic. According to my bike, I am doing about 20 miles in 60 minutes at an average heart rate of about 115 with very even breathing through my nose only and am able to carry on a conversation, and I have a pretty soaked shirt at the end. I think this means I am staying pretty aerobic and not burning protien. Do you think I have that right? I am also doing strength training and can tell a definite increase in muscle mass.MFP's philosophy is that you eat back the calories you burn during exercise.
depending on the rate of work you do, and your fitness, exercise will burn more fat than glycogen. when you eat it back, your body first tops up the glycogen. high glycogen levels keep your metabolism high, and keeps your body from stopping doing the day to day repairs that it needs, but tends to put off if food is scarce.
Low glycogen encourages the body to cannibalise muscle.
When you lose muscle, you lose it at a rate of about a pound every 1500 calories deficit.0 -
Maybe don't eat back all of those calories. I put your stats for 60 minutes at 115 bpm into 2 different calories-burned calculators and got 746 with one and 771 with the other.
http://www.triathlontrainingblog.com/calculators/calories-burned-calculator-based-on-average-heart-rate/
http://www.braydenwm.com/calburn.htm0 -
But I wonder how much of a problem muscle loss actually is? If we're losing muscle today but rebuilding it with tomorrow's strength training workout, then the net result is going to (eventually) be fat loss, correct? And my understanding is that we are constantly losing and replacing muscle tissue. Or maybe there's something I'm not getting?0
-
Thanks - I think for now I am going to continue as I have been and continue to make adjustments to see if the trends hold up. If I have to continue to make those kinds of adjustments to the data then I have something to worrry about. But I would rather not risk altering my course until I know for sure. I'm too happy with my progress and feel fine.Maybe don't eat back all of those calories. I put your stats for 60 minutes at 115 bpm into 2 different calories-burned calculators and got 746 with one and 771 with the other.
http://www.triathlontrainingblog.com/calculators/calories-burned-calculator-based-on-average-heart-rate/
http://www.braydenwm.com/calburn.htm0 -
One thing that would be worth explaining is the wavey patterns at the beginning of your graph where you get off to a slow start and accelerate beyond your predicted deficit. This might be due to muscle mass loss rather than fat loss, which would produce that kind of acceleration due to it being more dense than fat (and yet calculated as fat).
In the short term, water retention or dehydration that lasts > 5 days may produce differences of a few thousand calories that would show up on your graph despite the 7 day moving average.
The only other thing that springs to mind at the moment is monitoring changes in macronutrients, fibre and water consumption and relating them to short-term changes in weight, and that would be very in-depth analysis indeed.
I'd be tempted to write off the waviness around the trend as unimportant. Graphing real-world data is always messier than graphing calculated outcomes, but unless you're launching a space shuttle, it's the trend that is informative, not the individual data points--especially if what you're aiming for is a general proof of concept: in this case, that an individual user's weight loss over time CAN be adequately explained by the equation (Cals Out - Cals In)/3500 = lbs lost).I may have to express this data in some other terms to get a common comparison - currently I am using calories, but can I express things like muscle mass difference in terms of calories?
How does your scale represent the difference between muscle and fat? Unless there's something totally obvious that I'm missing, I think you could just add two more columns to your spreadsheet: one for lean body mass and one for fat. So each day's weigh-in would produce 3 numbers instead of 2. Your weigh-in data is already expressed in pounds (not calories), so this isn't going to add an inconsistency.
Then you could add a fat lost column next to actual weight lost, which would let you track the proportion of weight loss that is fat loss. If you felt like it, you could also add a lean mass column so that you can track changes in fat and lean composition at the same time. Ideally, lean mass would stay the same or trend up, while fat trends down.
Does your scale break out water as a separate value?0 -
an individual user's weight loss over time CAN be adequately explained by the equation (Cals Out - Cals In)/3500 = lbs lost).
And whether or not BMR is accurate.How does your scale represent the difference between muscle and fat? Unless there's something totally obvious that I'm missing, I think you could just add two more columns to your spreadsheet: one for lean body mass and one for fat. So each day's weigh-in would produce 3 numbers instead of 2. Your weigh-in data is already expressed in pounds (not calories), so this isn't going to add an inconsistency.
Then you could add a fat lost column next to actual weight lost, which would let you track the proportion of weight loss that is fat loss. If you felt like it, you could also add a lean mass column so that you can track changes in fat and lean composition at the same time. Ideally, lean mass would stay the same or trend up, while fat trends down.
Does your scale break out water as a separate value?
The scale measures weight, fat pct, water pct, muscle pct, and bone density. It's nothing super special - I found it on Amazon.com at marked down 50% (http://www.amazon.com/s/ref=nb_sb_ss_i_0_96?url=search-alias=aps&field-keywords=eatsmart+precision+gofit+digital+body+fat+scale+w+400+lb.+capacity+&+auto+recognition+technology&sprefix=eatsmart+precision+gofit+digital+body+fat+scale+w+400+lb.+capacity+&+auto+recognition+technology). It measures the body metrics by measuring reflection of a small electrical signal sent through the feet.
Yeah, I will record the actual values from the scales, but to make them comparable on the same graph, don't I need to express them in calories?. Maybe it will be simple enough to multiply my weight by the percentages and then convert that to calories for graphing. Gotta check that out. Or, I guess I could chart them on their own charts and just superimpose them to see the relationships of change. I really want them on the same graph though. I wonder if there is some way to have Excel superimpose them.0 -
I love what you've done with the spreadsheet! I have attempted to figure out the "math" of weight loss for the last few weeks. I would love to be able to plug my figures into your spreadsheet. If I send you my email, can you email your spreadsheet to me? I have attempted to do the "math" myself and unfortunately, it is not coming out I think it should. I have been exceeding my planned, as far as calories burned (through exercise) and yet my weight loss is not matching up. I tell myself it is because my body had virtually no muscle from years of being overweight and my body is trying to build some.. I am 5'7" and started MFP at 239.9 Feb. 21, I started using my treadmill hardcore March 21, I went from virtually not exercising to spending usually 60 min., often 90 min., and occasionally 120 min. on the treadmill each day. I have iFit Live with Jillian Michaels, so it adjusts my speed and incline automatically with a new workout each day. I have lost 15lbs in approx. 7 weeks, but if my weight loss followed my recorded calories burned, I should have lost more weight. Just when I thought I had the "math" figured out, I don't, or at least my body doesn't!
I look forward to more spreadsheets 0 -
Hi. Are you me?
:laugh:
Seriously. LOVE the charts. Nice work. 0 -
I'm gonna see if I can find an FTP site somewhere that we can share our spreadsheets. In the meantime I would be happy to send mine via email if you want to send me an email address via the MFP message system. Cool stuff!!!!!0
-
Here is my current graph. Following Helenium’s pattern, I am now referring to what I record in MFP as “Expected” instead of “Recorded” (cuz it makes more sense) and am only showing “Expected” and “Actual” because all I want is to determine that I can accurately track and predict what my body is doing.
As you can see, I hit a small plateau starting at about day 37 which I broke at about day 46. The one thing that I consciously did to break the plateau was INCREASE my calorie intake which echoes all of the advice concerning staying at your target and possibly eating back your exercise calories (although I don’t think I have analyzed that enough yet to know for sure).
So this just represents a theory and I don’t feel like it can be called anything conclusive. I would have to test this over and over to prove or disprove. By that is not my goal – I don’t want any more plateaus!!! I want to lose weight and get fit. But it is fun and interesting to me 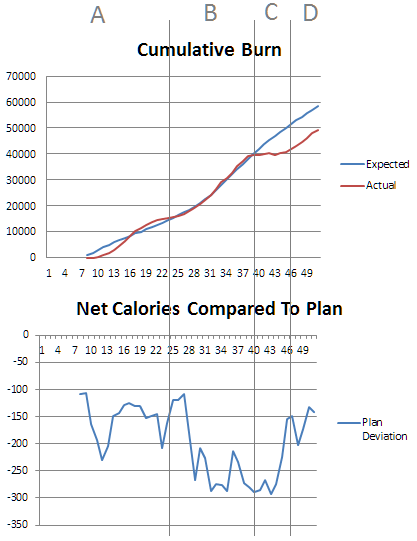
SECTION A
As noted previously, I got a lot more serious and made many changes at about day 20 or so about diet and exercise. So I won’t concentrate on this section.
SECTION B
Perhaps a reflection of more seriousness, I consistently consumed between 200 and 300 fewer calories than my MFP target. As a result, I did lose weight at a rapid pace, but…
SECTION C
My body finally said “enough – we are in a famine” and began holding on to the calories for reserves. The result was a plateau.
SECTION D
Towards the end of the “famine”, I began consuming more calories and as a result, my body said “famine is over” and began giving up the calories once again.0 -
Total of .5 lbs lost for the entire month of April
Beginning January 1, I reduced my calories in by 300 per day and increased my calories out by 2500 per week, which (if weight loss were rational) should have produced a net loss of 5-6 lbs per month. For January – March my total loss was 19 lbs—right on target. (Yay!! Math wins.)
I’ve continued to meet or fall below my calorie goal every single day in April (except yesterday), and I’ve continued to use 2500 calories in exercise each week, and so far my total weight loss for April is one half of a pound. (Math takes serious damage.) I wish I could say that I too am experiencing a plateau due to false famine, but my calorie goal is 1880, and my actual consumption ranges from 1500-1880, so even the more avid supporters of eating back your exercise calories would probably agree that that's not the issue.
I've looked at my food diary to see what I can change, and the obvious answer is the daily allotment of 2 (9.5 oz) bottles of Starbucks mocha frappuccino, plus one (12 oz) homemade equivalent each day. Altogether, that's 234 mgs of caffeine and 540 calories per day.
Past experience tells me that it takes about 3 weeks to step down from a full-blown caffeine addiction to no caffeine at all, so that’s my goal for the next three weeks. My goal is to reduce calories by a total of 300 over the same period.0 -
I should also note that I compute my own calorie goals which is already a bit lower than what MFP would calculate for me. So when I say that I am 200-300 below my target, that is more than what MFP would compute. I'll compute it for MFP to see what the difference is.0
-
so, doing the maths, your daily target deficit is 650 calories, and you're achieving an actual daily deficit of 650-1000 calories?so even the more avid supporters of eating back your exercise calories would probably agree that that's not the issue.
I'd say you were likely to be doing your body harm with that regime, not just "starvation mode"0 -
No, I explained it badly. My original MFP calorie goal was set for 1900 (MFP's calulation of my maintenance calories at my starting weight). I knew from past experience that my actual maintenance requirement is more like 2100, so I thought that if I ate 1900 per day and used 360 per day in exercise, I would lose about a pound a week.
After the first month, my calorie consumption trended down a little (averaging about 1850), and I continued to use about 2500 calories in exercise per week. From January 1 (my MFP start) to March 27, I lost 18 pounds--a higher loss than predicted. However, my weight loss has nearly stalled. I've lost 5. lb since March 27.
MFP calculates my maintenance at my current weight of 1882 calories per day. If I reduce my daily intake to 1700 (gross) and continue using about 360 calories per day in exercise, I think that gives me a weekly deficit of about 3500 calories.
However, numbers confuse me, and I'm already suffering from lack of caffeine, so I'm willing to believe that I'm completely wrong about all of this.
Also the unfairness of April is leaving me feeling extremely superstitious about weight loss--was it too much sodium? too little potassium? not enough blue fruits? an angry god? wrong kind of cardio? so I'm not at my most rational.
so, doing the maths, your daily target deficit is 650 calories, and you're achieving an actual daily deficit of 650-1000 calories?so even the more avid supporters of eating back your exercise calories would probably agree that that's not the issue.
I'd say you were likely to be doing your body harm with that regime, not just "starvation mode"0 -
In the interests of thinking less, I reset my MFP goal to 1300 calories and plan to eat my morning exercise calories but not the evening ones. That should motivate me to work really hard in the morning.0
-
Where is the 'love' button for this discussion?! WOW!

Created by MyFitnessPal.com - Nutrition Facts For Foods0 -
This is the "nerd room" :ohwell:Where is the 'love' button for this discussion?! WOW!0 -
I'll post a chart for April soon. Even before charting it, I've learned two useful things from the data.
1. My average (actual) daily deficit for April was -456 calories,which is almost exactly 1lb per week (3.9 lbs in 30 days)
My total weight lost in April ended up being 4lbs. OMG!! It works.
Or at least it sort of works: 2.5 lbs of the loss occurred in the last four days of the month, which means that for most of the month, starting weight - calorie deficit DID NOT predict actual weight, and since a 2.5 lb loss in 4 days is pretty improbable, I think it will be mid-May before I can really tell what my actual loss was for April. So it works, provisionally. For now.
2. My daily deficit is a lot smaller than I thought it was. I have a tendency to notice the deficit on days when I exercise and to ignore it on days when I don't, which I think explains why my mental running total of how much weight I should have lost tends to run high. Will try to build a smarter mental calorie counter.0


This discussion has been closed.
Categories
- All Categories
- 1.4M Health, Wellness and Goals
- 398.2K Introduce Yourself
- 44.7K Getting Started
- 261K Health and Weight Loss
- 176.4K Food and Nutrition
- 47.7K Recipes
- 233K Fitness and Exercise
- 462 Sleep, Mindfulness and Overall Wellness
- 6.5K Goal: Maintaining Weight
- 8.7K Goal: Gaining Weight and Body Building
- 153.5K Motivation and Support
- 8.4K Challenges
- 1.4K Debate Club
- 96.5K Chit-Chat
- 2.6K Fun and Games
- 4.8K MyFitnessPal Information
- 12 News and Announcements
- 21 MyFitnessPal Academy
- 1.6K Feature Suggestions and Ideas
- 3.2K MyFitnessPal Tech Support Questions
Do you Love MyFitnessPal? Have you crushed a goal or improved your life through better nutrition using MyFitnessPal?
Share your success and inspire others. Leave us a review on Apple Or Google Play stores!
Share your success and inspire others. Leave us a review on Apple Or Google Play stores!