Please show us some Progress Graphs
Options

rvicini
Posts: 252 Member
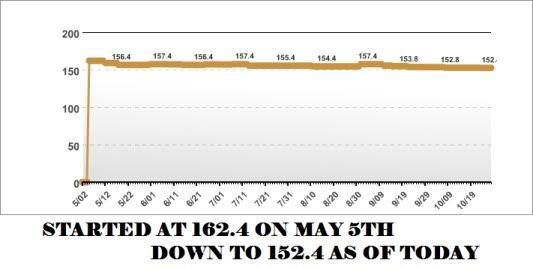
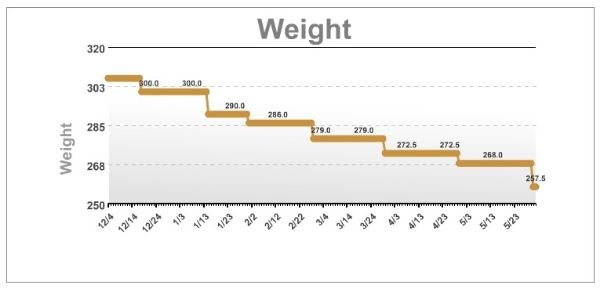
Everyone loses weight differently. Regardless of pictures in this thread, would you show us progress graphs? It is great for everyone to understand how different people lose weight in what time.
0
Replies
-
 0
0 -
stines72-I'm confused. According to your graph you lost 19 lbs. between 10/1 and 10/4 (?). Please explain.0
-
stines72-I'm confused. According to your graph you lost 19 lbs. between 10/1 and 10/4 (?). Please explain.
i started on MFP towards the end of my weight loss.. i just logged my weight of the day before i started exercising religiously which was july 4th as 130 lbs.. and then the day i started MFP i was 1110 -
So the above graph isn't really reflective of your actual weight loss within those dates then, right?stines72-I'm confused. According to your graph you lost 19 lbs. between 10/1 and 10/4 (?). Please explain.
i started on MFP towards the end of my weight loss.. i just logged my weight of the day before i started exercising religiously which was july 4th as 130 lbs.. and then the day i started MFP i was 1110 -
right, and the rest was a plateau, just started losing again
So the above graph isn't really reflective of your actual weight loss within those dates then, right?stines72-I'm confused. According to your graph you lost 19 lbs. between 10/1 and 10/4 (?). Please explain.
i started on MFP towards the end of my weight loss.. i just logged my weight of the day before i started exercising religiously which was july 4th as 130 lbs.. and then the day i started MFP i was 1110 -

all in all a slow but steady weight loss......
in this time period i also went on at least 5 vacations, and i don't exercise too much (although I will soon enough), so that just gives you an idea that weight loss can happen just by eating healthy enough, even if exercise isn't involved, although i'm not saying you shouldn't exercise, it helps a lot..0 -
 0
0 -
Here's mine. Started recording daily weigh ins about 2 weeks after I started. the red line is a 5-day average, the blue is actual weight each day. I weighed in this morning at 150.6, my UGW is 130.

ETA: the starting date for this graph is June 12, 2012, and the end is today, 10/28/1220 -
Here's mine. Started recording daily weigh ins about 2 weeks after I started. the red line is a 5-day average, the blue is actual weight each day. I weighed in this morning at 150.6, my UGW is 130.

ETA: the starting date for this graph is June 12, 2012, and the end is today, 10/28/122
It is a great graph dylilly2005. Mine is ready. I will post as soon as I figure out how. It is important in your case that we all understand the trend. The trend is definitely down. There are ups and down in the weight line, but the general trend is down...0 -
It's definitely helpful when having a "down" day. I'll sit and think "I haven't made any difference at all!" (though that's the irrational side of my brain talking, because I know I have). And then, boom! Numbers to back it up. Can't argue with data!
 0
0 -
 0
0 -
Bump to reply when I get home.
 0
0 -
onyxgirl17, where do you do your graph at? I'm a graph junkie. Love looking at graphs. Love making graphs and your graph is a beauty!
 0
0 -
onyxgirl17, where do you do your graph at? I'm a graph junkie. Love looking at graphs. Love making graphs and your graph is a beauty!

https://www.fourmilab.ch/cgi-bin/HackDiet?s=41W779F6WQG2K58G569W286F0W238Q00Q63020Q3&q=histreq&HDiet_tzoffset=240
here... you have to create an account but it's free0 -
How do I get my MFP graph to copy and paste?0
-
How do I get my MFP graph to copy and paste?
you will need to take a screenshot.. if you are on windows 7, go to the start menu and type in "snipping tool" and just select the area and save it as a picture, then upload it somewhere like imgur.com0 -
17Aug2012@253.6 --> 29Oct2012@219.0 (daily weights in pounds)

Have recently been tweaking some numbers as the slope is trending less negative...0 -

I haven't weighed as often in October, which I now wish I had - I was having plateau issues, followed by abrupt dropoffs and I would just record things when I got a new low weight. I know, not the best approach, but it hurts to see the number start creeping up again.
I was hoping to be at my goal weight (~160lb) by the end of the year but at this pace it will probably be more like January/February... or a little later since I have less drive to exercise in the cold weather. Fortunately, I'm pretty good at the calorie restriction thing.0 -
 0
0 -

I started out at north of 215 pounds last summer, and I slowly worked my way down to 155 this summer. I sat at 155 for a couple months, and decided to get more serious about my weight loss.
So this is the result of the past couple months' work.
Lots of peaks and valleys, eh? Such is life.0 -

What app is this pulled from?0 -
Up!0
-
Shoot, you guys have cool graphs!

Here's mine: 0
0 -
This is my average graph. The average is the solid line, the real weight is dotted line. I weight everyday so the average is of the last five days. Clearly there is a down trend, regarless of a historic low.
 0
0 -
However want to show us your graph would be great!0
-


 0
0 -
I am wish I would have picked an alternate source to track my weight (one with a much cooler looking graph lol.)
 0
0 -
Weight alone:

Weight, Total Calories Eaten, & Estimated TDEE:
edit: forgot to resize image.0 -
Graphs show us trends. Do we go down all the time or most of the time? Have we gained back weight or just retention? That is answered by our graphs. Show us yours and explain it!0
-
Up!0
This discussion has been closed.
Categories
- All Categories
- 1.4M Health, Wellness and Goals
- 396.8K Introduce Yourself
- 44.2K Getting Started
- 260.9K Health and Weight Loss
- 176.3K Food and Nutrition
- 47.6K Recipes
- 232.8K Fitness and Exercise
- 451 Sleep, Mindfulness and Overall Wellness
- 6.5K Goal: Maintaining Weight
- 8.7K Goal: Gaining Weight and Body Building
- 153.3K Motivation and Support
- 8.3K Challenges
- 1.3K Debate Club
- 96.5K Chit-Chat
- 2.6K Fun and Games
- 4.5K MyFitnessPal Information
- 16 News and Announcements
- 18 MyFitnessPal Academy
- 1.4K Feature Suggestions and Ideas
- 3.1K MyFitnessPal Tech Support Questions


